S / R Levels - Jan 6 - 10
35 securities with key entry and exit levels - Essential to validate setups
In trading and investing, it's essential to avoid acting on impulse. Support and resistance levels offer valuable context, helping to validate potential trading setups. By waiting for price action to confirm a break of resistance or a bounce off support, you can significantly reduce the risk of premature decisions and increase the probability of successful trades.
Market noise and short-term fluctuations can often create false trading signals. Support and resistance levels act as filters, helping you distinguish between genuine breakouts or breakdowns and mere market noise. By requiring confirmation at these key levels, you can avoid acting on false signals and make more informed trading decisions.
While indicators and chart patterns can provide valuable insights, they should always be considered in the context of support and resistance levels, that’s why these figures are essential in the Weekly Compass. These levels represent key areas where buying or selling pressure is likely to increase, and they offer crucial validation for any trading setup.
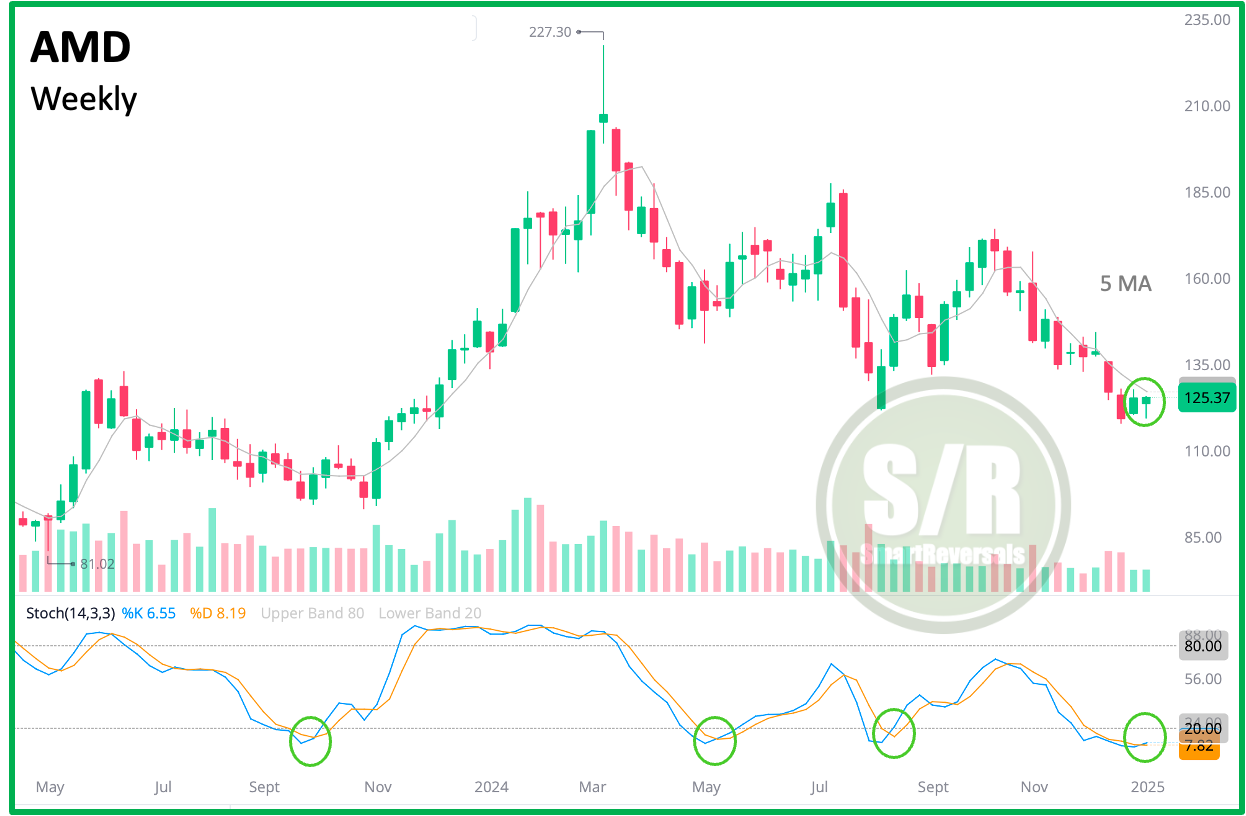
Let’s analyze AMD, which is showing a reversal setup considering indecision candles in oversold area considering the oscillator. Risk - reward favors bulls, but using S/R levels provides better validation.
35 securities are analyzed below, AMD is one of them, so this is how it works:
The Setup is: Bullish Reversal Likely
Central Weekly Level: As long as price stays above $123.46, the bullish thesis is intact
Immediate bullish target: $ 127.47 (1.7% increase), an options scalper can monetize well with that move, managing risk using $123.46.
Bearish target if the central level is breached: $ 121.35 (-3.2% decline), also an interesting move for puts, managing risk at $123.46 in case of a false breakdown.
If price action crosses in a solid fashion (conviction candles in 4H or 2H timeframes) the next immediate targets would be the next S/R levels: $ 129.58 and $ 117.34 respectively.
There are Monthly levels as well:
They can be stronger lines, and the closest one is $127.6; that level may bring some turbulence considering its confluence with a weekly level. If $127.6 is crossed with a solid daily candle, the next target would be $137.31.
S/R levels help define potential entry and exit points, and take-profit targets.
If you invest for the long term in an asset, the monthly and weekly charts are key, and currently the market is showing overheated conditions, so the central weekly level can be used as a take-profit reference.
When conditions are not overheated, the monthly levels are useful for investors.
For traders, both type of levels are key.
Overheated conditions?
The monthly chart for Nasdaq100 presents a monthly gravestone candle with high volume validating the warning, and RSI is above 70. Previous occurrences are highlighted:
November 2021: An Early Warning followed by another indecision candle, 2022 followed.
February 2021: Followed by a healthy -5.3% pullback from the close of the warning candle, or -12% if you take the high of the gravestone candle to the low in March.
February 2020: The COVID crash, a -30% from the high to the bottom in March.
September 2018: Not highlighted since the candle is not a gravestone, but the doji with RSI at 81 was the warning for the -23% bear market in 2018.
The S/R levels include the following securities: SPX, NDX, DJI, ES=F, NQ=F, SPY, QQQ, IWM, DIA, SMH, TLT, TQQQ, SQQQ, UPRO, SPXS, UDOW, SDOW, URTY, SRTY, NVDA, META, MSFT, AMZN, GOOG, AAPL, TSLA, NFLX, COST, MSTR, PLTR, AMD, GLD, SLV, Bitcoin, and Ethereum. If you invest or trade some of those securities (this is not suggesting you have to invest in all of them), this publication is for you.
Tomorrow the Weekly Compass will include monthly charts for the most meaningful setups in that timeframe.
WEEKLY LEVELS:


