
S / R Levels - Nov 4 - 8
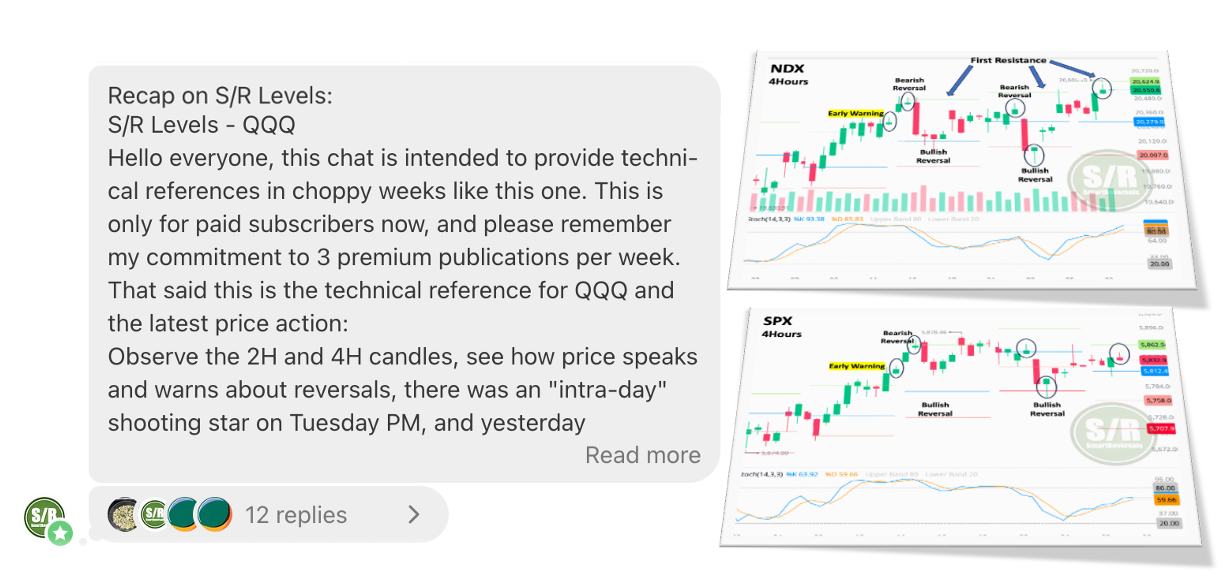
The bearish reversal signal for the week was printed on Tuesday for NDX and SPX; it happened at a resistance level anticipated last Friday - 20 Securities update.


A correct reading of technical indicators increase the probabilities of predicting correctly the upcoming price action. The Support and Resistance levels help to validate them, preventing premature or incorrect decisions.
During the last weeks more subscribers have been asking for more details about how to use these levels, for that reason I’ve provided extensive educational content during the last three weeks; I recently activated the chat for paid subscribers, so more questions are solved and I use that channel to provide commentary when needed.
Most of the bearish signals anticipated last weekend were triggered, these S/R levels set the price action parameters ahead of next week, when the FED decision will move the markets.

Subscribe, in the middle of the bearish sentiment and noise, the Weekly Compass was accurate during September and the first half of October about the bullish target for SPX, ending up shy only by seven points of the actual top for the index.
When the Weekly Compass alerted about potential reversals, the market started its decline, and last week the landscape was weak for the week, the indexes closed in the red. Tomorrow’s edition will bring timeframes that will show the warnings switching from yellow to orange.
The S/R levels set the levels that once lost, the bearish setups are confirmed, and same for bullish reversals.
This edition presents the update of the Weekly and Monthly Support and resistance levels for SPX, NDX, DJI, IWM, SPY, QQQ, TLT, ES=F, NQ=F, NVDA, META, MSFT, AMZN, GOOG, AAPL, TSLA, GDX, SILVER, BITCOIN, and ETHEREUM.
Weekly and Monthly Levels: