S / R Levels Oct 21 - 25
20 securities with their Support and Resistance levels for the week ahead. Educational Content about using key levels


In an ocean of bearishness, the Support / Resistance levels proved their worth, the central level for SPX was $5774 for the week that just ended, that level and many others were not breached by the close of a 4H candle or a daily one.
Last Friday I did something unusual, sharing gains of the day, the objective was to highlight the relevance of these levels since they are key for my trading. My charts and analyses have a high level of probability in their outcomes, I add a layer of protection with this levels.
During the last month the community has grown and some subscribers have asked me about how to use even better these levels, I’m always happy to hear you all, so let’s study more about Support and Resistance Levels:
Support and Resistance Levels - What is That?
They are horizontal lines on a chart that indicate areas where a security's price has historically found support (resistance) and may do so again in the future. They can be used to validate existing trends and identify potential reversal points.
What are they useful for?
Validate Uptrends: If the price consistently bounces off a support level during an uptrend, it validates the bullish trend. Conversely, if the price breaks below a support level, it could signal a potential reversal.
Validate Downtrends: If the price consistently bounces off a resistance level during a downtrend, it validates the bearish trend. Conversely, if the price breaks above a resistance level, it could signal a potential reversal.
Analyze Potential Reversals: When the price reaches these levels, it may reverse direction, providing potential signals for traders to enter or exit positions. Candlesticks must be analyzed and ideally an oscillator.
Watch for Breakouts and Breakdowns: A breakout occurs when the price breaks above a resistance level, while a breakdown occurs when the price breaks below a support level. These can signal significant changes in the trend.
Here are some methods for setting support and resistance levels:
Previous Highs and Lows: Look for previous highs and lows on the chart. These points often act as support and resistance levels.
Moving Averages: Use moving averages (e.g., 50-day, 200-day) as support and resistance levels. When the price breaks above a moving average, it can act as support, and vice versa.
Fibonacci Retracements: Use Fibonacci retracement levels to identify potential support and resistance levels based on mathematical calculations.
Trend Lines: Draw trend lines connecting a series of highs or lows. These lines can act as support and resistance levels.
Psychological Levels: Round numbers (e.g., 100, 200, 500) often act as psychological support and resistance levels.
There are two good news for you:
You don’t have to stress out about calculating them, every Friday you can receive seven layers of Support and Resistance Levels for 20 securities, you just have to print them out as some subscribers do, and draw them in your charting platform for the securities you trade.
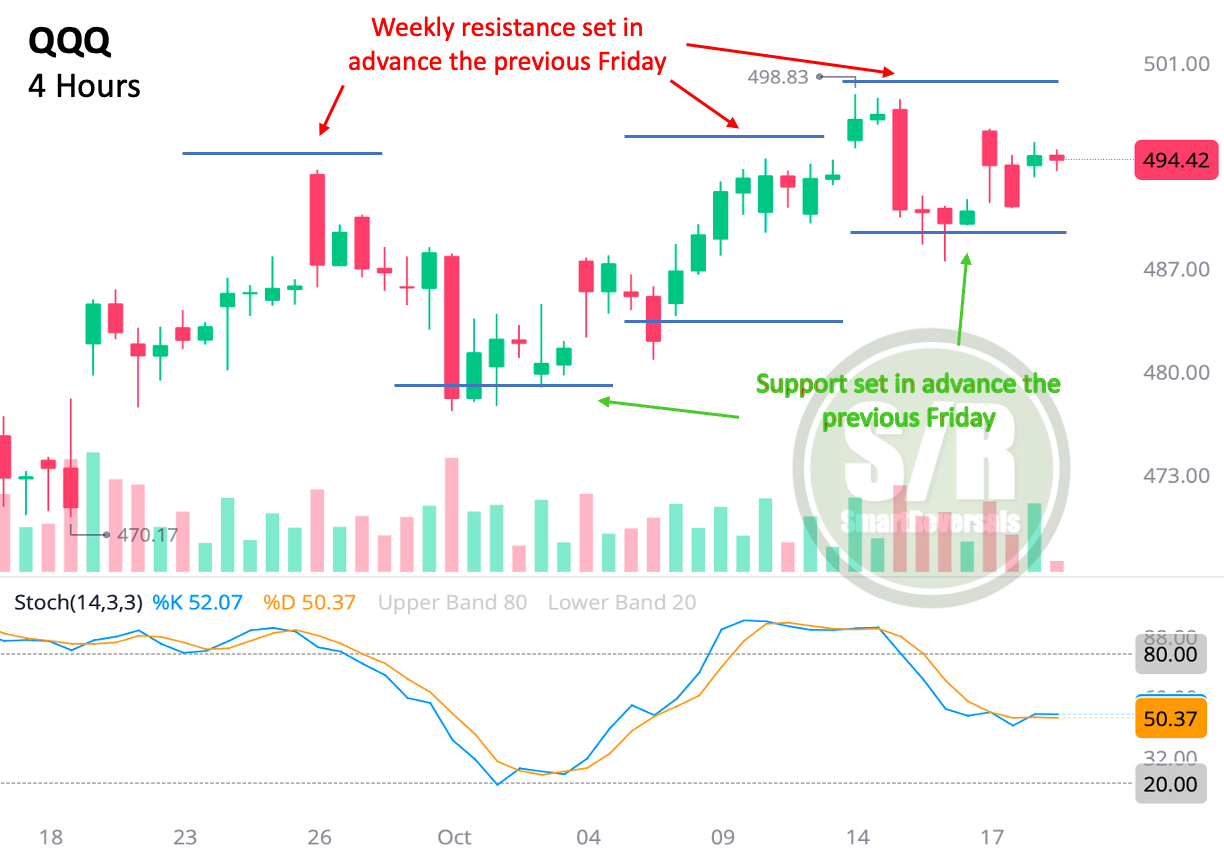
The levels provided every week are calculated ahead of time, the levels have proven to work, this example for QQQ (one of the 20 securities provided), shows weekly S/R levels provided the previous Friday in this edition:

As you see I use oscillators and candlesticks in this analysis as I do in the charts published in the Weekly Compass, other indicators like Bollinger Bands are also useful, but let’s focus on S/R levels.