
S / R Levels - Oct 28th - Nov 1st
A sell signal was triggered based on these levels when $5849 was lost for SPX on Wednesday. This golden tool also triggered a sell signal for IWM on Tuesday. Get access to the updates.


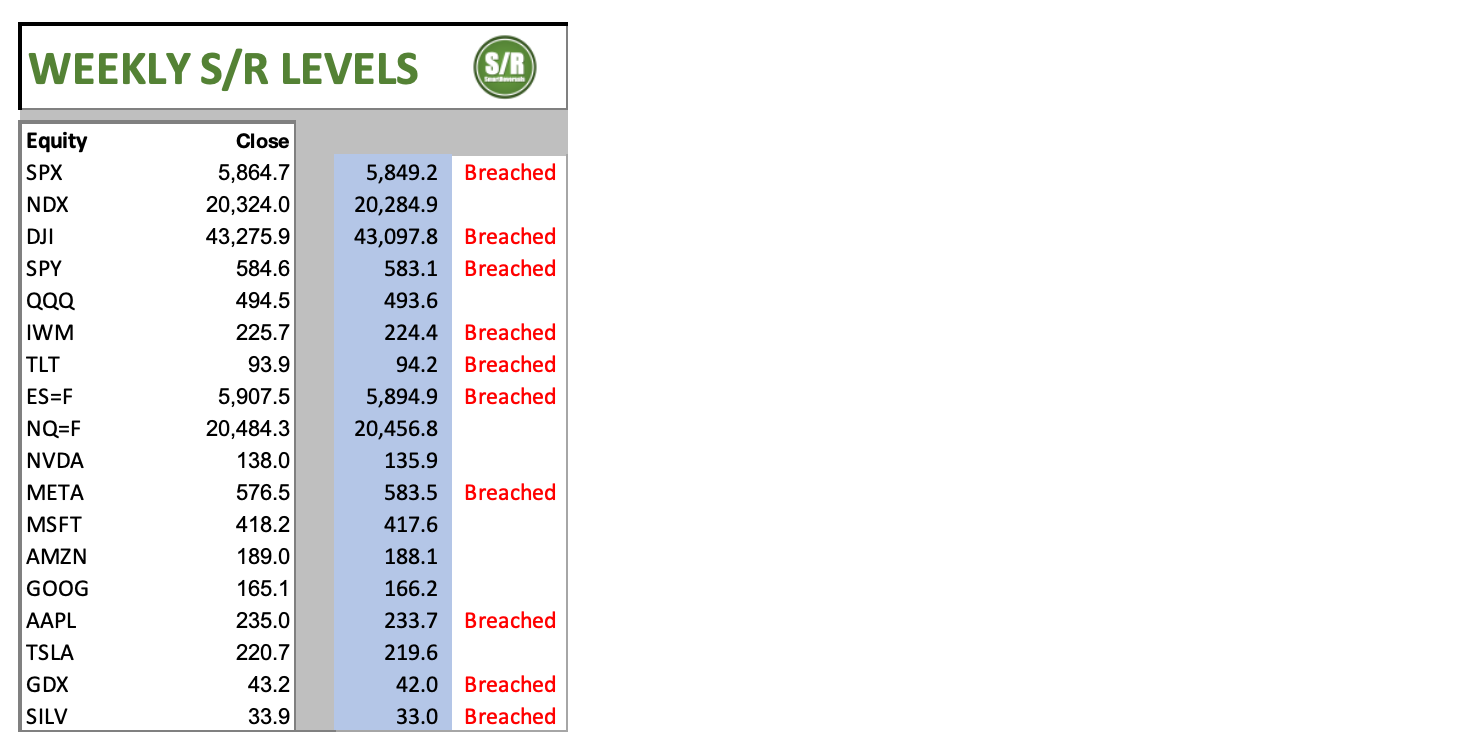
Last week these levels acted as a validation of the uptrend for the SP500 and Nasdaq, for this week that is ending they triggered sell signals for several securities including SPX, DJI, IWM, AAPL, GDX, and more.
The expected choppy price action happened during the week, and for that reason a comprehensive educational content about how to use support and resistance levels was published for everyone last Friday, you can get access here, and the premium segment provided guides about how to set a stop loss:

The levels below were shared last week as the lines that once breached, would set a bearish mode based also on the weekly setups presented in the weekly compass:
Several securities are raising warning signs, most of them have a bearish setup as presented in the latest Weekly Compass edition.
As an additional guide for premium subscribers, I have activated the premium chat, which will be used one or two times per week providing references of how to navigate the levels, last Thursday QQQ was presented with details.

The weekly candle is bearish for SPX, DJI, IWM, AAPL, GDX; and it is showing indecision for QQQ, NDX, AMZN, and META. The following are the Support and Resistance Levels for next week, and tomorrow you will receive the Weekly Compass, with technical analysis for a complete picture.
The main question today is: What is the level that has to be recovered next week to consider a (potential) bullish reversal valid?
The answer is: Not the levels that were lost and are presented in the table above, the market does not work that way, a bounce is required indeed, but the levels have adjustments every new week based on the recent price action.
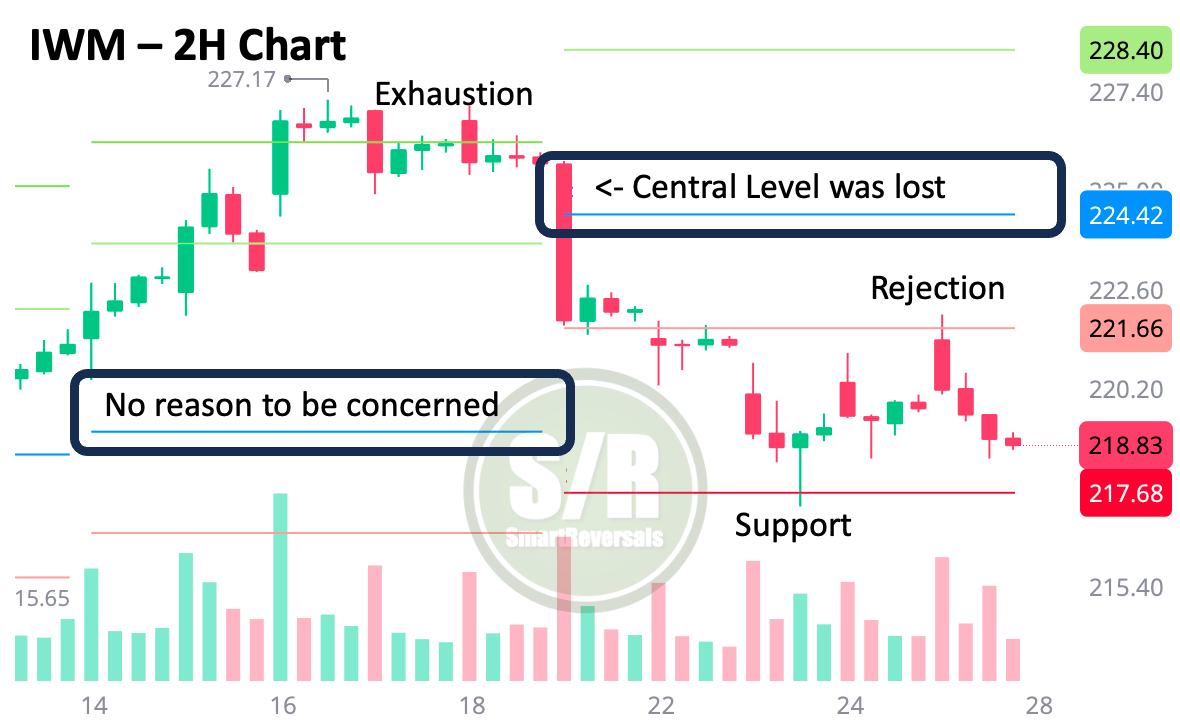
The following chart presents how the S/R levels shared in advance every week, worked for IWM, observe that every week the levels are updated, and they indeed influence price action, the exhaustion, support and rejection levels highlighted are quite useful for swing and even day traders; the central level work for them and position traders who know that it is time for a pullback, and they want to take actions when bearish signals emerge:
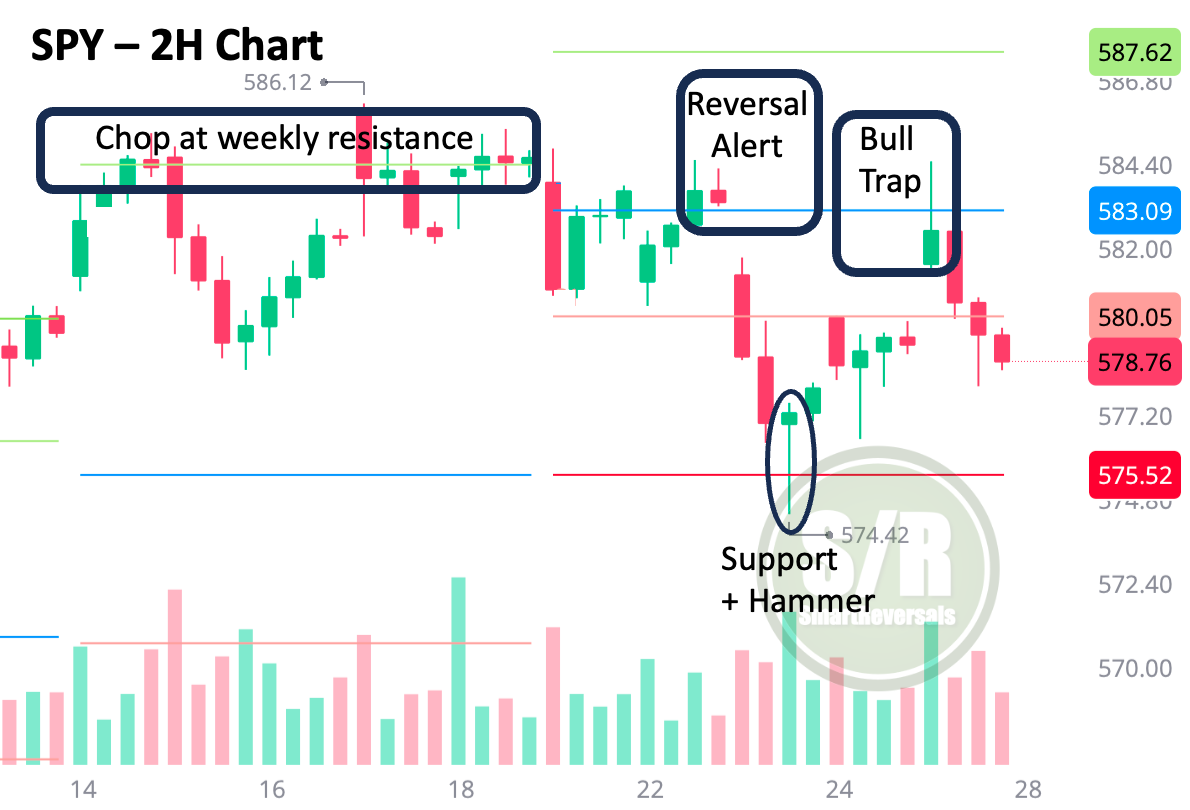
The case for SPY is similar, presenting the chop at the resistance zone last week, a reversal alert with a shooting star on Tuesday afternoon, a bullish hammer that anticipated a bounce on Thursday even before TSLA earnings; and finally: the beauty of using this levels may have prevented you to fall in the bull trap today. Remember: 4H, daily or 2H candles, not less.
These updates started to be presented in the CHAT for premium subscribers.
Securities analyzed in this edition including seven layers of S/R levels: SPX, NDX, QQQ, DJI, IWM, TLT, SPY, AAPL, GOOG, TSLA, META, NVDA, MSFT, AMZN, GDX, Silver, ES=F, and NQ=F, Bitcoin and Ethereum.
Weekly and Monthly Levels.
Weekly Levels: