
S / R Levels - Sep 2nd - 6th
The weekly chart printed a hanging man candle for SPX, NDX, and IWM; but time DJI broke out. Who's telling the truth? - Having levels at hand is key. The weekly & Monthly ones updated are here.


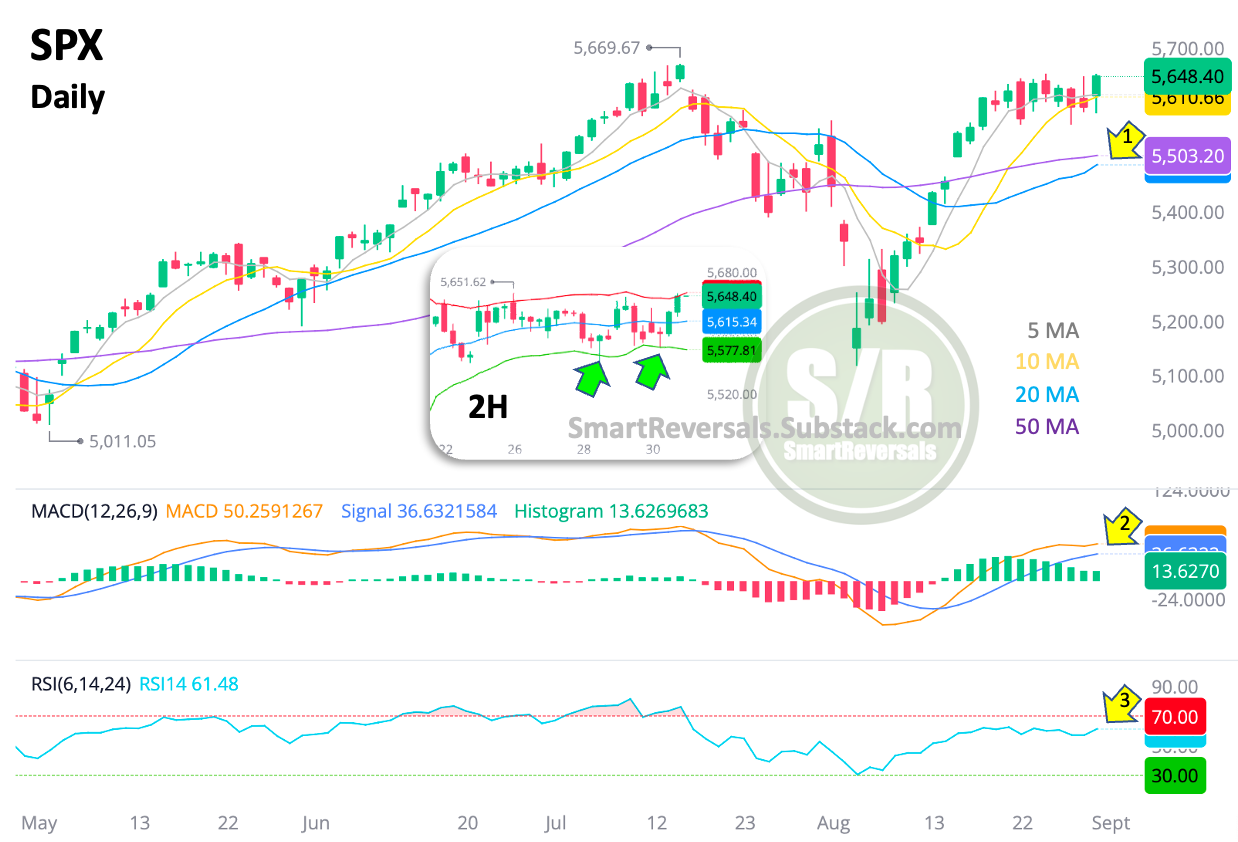
What a Way to Close the Month! The consolidation process unfolded an unexpected turnaround during the afternoon, after a bullish dragonfly in the 2 hours chart as zoomed in.
The status as of now for SPX is:
1) A potential bullish cross between the 20 and 50DMA.
2) A potential avoidance of a bearish MACD crossover
3) Still distance to overbought levels relative to RSI.
The daily and 2 hours candles suggests bullish continuation, unless Monday's futures session brings a surprise. Yes, the close on a Friday is tricky since reversals can come on the futures session between Sunday PM and Monday noon when there is a holiday. I’m not saying that’s going to happen, but I’m sharing with you a couple of surprises I’ve experienced after holidays.
The best way to be prepared is having levels at hand, and their amplitud for next month is high, which is consistent with extreme range where price moved during August.
Since there are new members in the community, this edition has a reference of how the S/R levels have worked, so depending on which security you trade, you include these levels in your chart, my examples are usually on SPX, but you can use the levels for NDX, IWM, TSLA, NVDA, GDX, SILV, OIL, SPY, QQQ, Futures, Bitcoin, Ethereum and the other securities included.
The first chart shows the relevance of the monthly levels, and you may remember when I published a brief special publication on Sunday, August 4th at night, when the futures were crashing. That special publication anticipated a bounce and the session had not even open!
The reason was the extreme oversold levels reached by the futures and the subsequent similarity that SPX was going to print the day after: