
Seasonality and High Probability Setups
Semiconductors are cracking while the Magnificent Seven are bouncing.


In the Weekly Compass posted on Saturday, I highlighted a distinct peculiarity: the exceptionally high volume observed on Friday for the Magnificent 7. This volume was so massive that, despite the lack of a solid, bullish setup at the time, it stood out as an odd anomaly. High volume was a key signal since most of the Magnificent 7 names were oversold on the daily timeframe. Consequently, the current spike was a distinct possibility and as usual I provided specific price levels that the price should recover to validate the bullish reversal and specific targets in the Setups Blueprint. For example: if TSLA recovered $387.9, a move to $407.1 was possible, the stock closed today at 425 for a +12% weekly rally so far; for META “the probabilities for a bounce are considerable” was the note on Saturday, $555 was the trigger to turn bullish, the stock exceeded the last weekly target of $606 today with a cumulated weekly move of +11%.
As mention to subscribers, I highlight some setups, but every Saturday the setups blueprint studies over 30 setups covering all the mag 7, key ETFs like SPY, QQQ, DIA, IWM, SMH, GLD, SLV, megacaps like AVGO, AMD, and now SpaceX (SPCX) as well. Unlock that valuable information using clear triggers and targets, zero gut-feeling, and setups explained transparently by subscribing to the paid plan.
The semiconductor weakness anticipated last week in the Weekly Compass is in play while the Magnificent 7 are bouncing. As promised, today we will analyze each of the Magnificent 7 stocks individually, utilizing our levels to closely monitor their price action.
Seasonality vs. Reality: The July Data
Next, let’s address a very popular topic right now: July seasonality. Social media is flooded with statistics pointing to a guaranteed bullish July. Over the last 10 years, July has indeed been consistently bullish, even during broader bear market years.
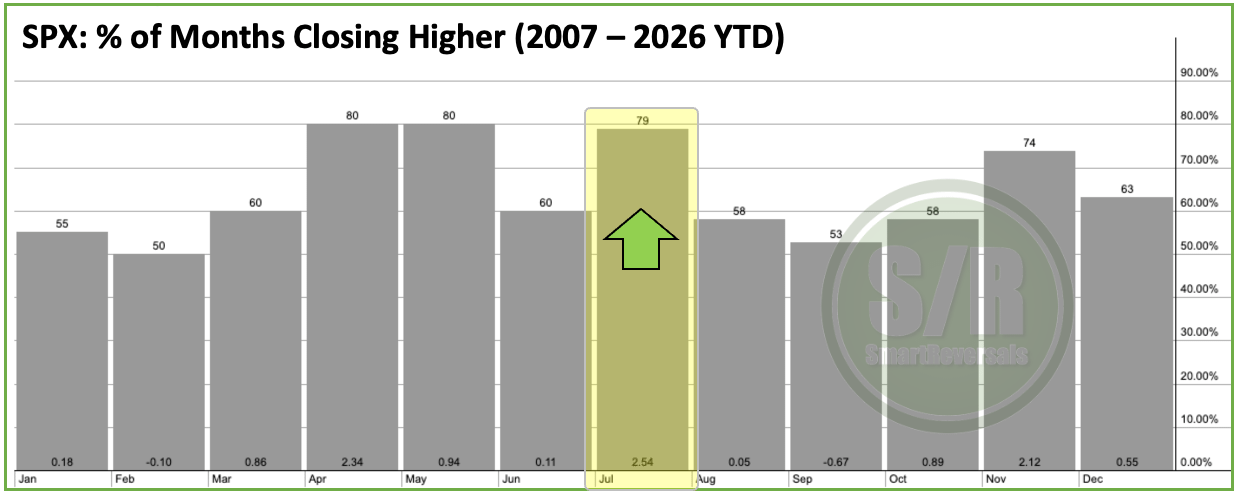
I have brought some charts that break down the percentage of positive months over a broader 20 year range. On that timeframe, July ranks as one of the most bullish months of the year, finishing positive 79% of the time.
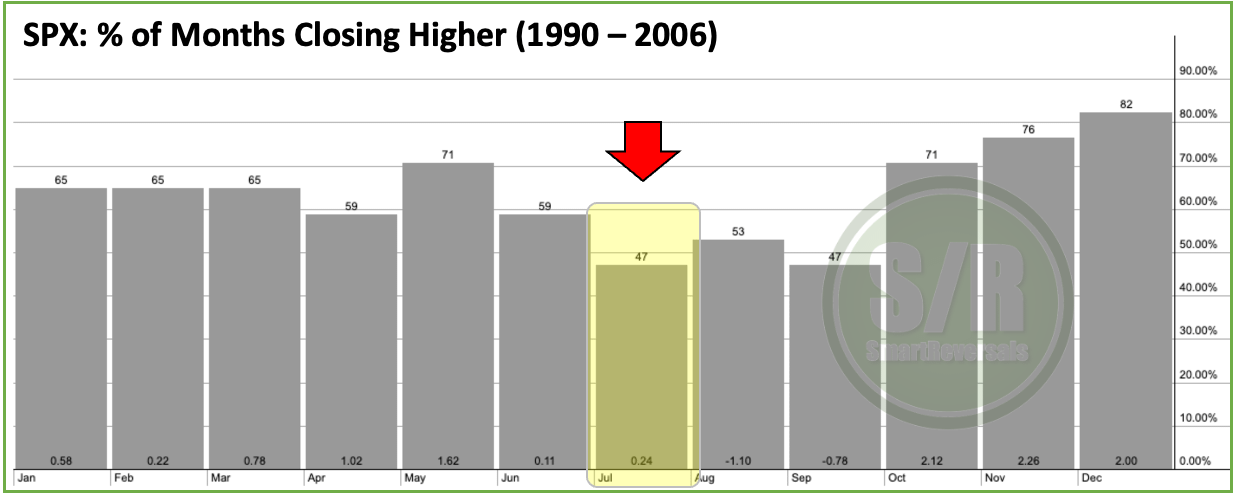
However, if you zoom out further and analyze a different historical period, such as 1990 to 2006, the statistics completely invert, making July one of the most bearish periods of the year.
As I always emphasize to premium subscribers: always do your own charting and never blindly trust the beautiful tables posted on social media. When you see historical results boasting a 90% or 100% win rate (my minimum threshold), then check the sample size. Is that percentage reflective of all market cycles, or is it just a cherry-picked portion of data? That is exactly the case with current seasonality metrics.
The ultimate solution to navigating this is relying on our Central Monthly Level and weekly levels to assess short-term momentum, backed by chart analysis. On Saturday, we identified that semiconductors were cracking. Even on the night Micron posted its earnings report, we anticipated the resistance zone. The subsequent price action confirmed the moves from the specific coordinates provided to our premium members.
You can read the Weekly Compass and all the articles on SmartReversals.com.
Today, in addition to the Magnificent Seven, I will cover the setups anticipated last week, starting with the SPX. The technical analysis presented to subscribers anticipated a bounce targeting 7,491.3. which represents the core consolidation zone where price has spent the last day and a half 🎯. The condition for this setup was a clean recovery of the Central Weekly Level at 7,392. On Monday, price reclaimed that level, triggering a clean bullish setup during market hours with no subsequent breaches of the Central Weekly Level.
MSFT, a stock that displayed a solid, bullish setup validated by high volume. The expectation was a bounce of at least 3.4% to 388.4, which has served as the high of the week 🎯.
PLTR was also highlighted as a reversal. Recovering $116 was the trigger, it was expected to reach 125.7 for an 11.3% bounce from Friday’s close. That target was met 🎯, and price is currently consolidating at that level.