


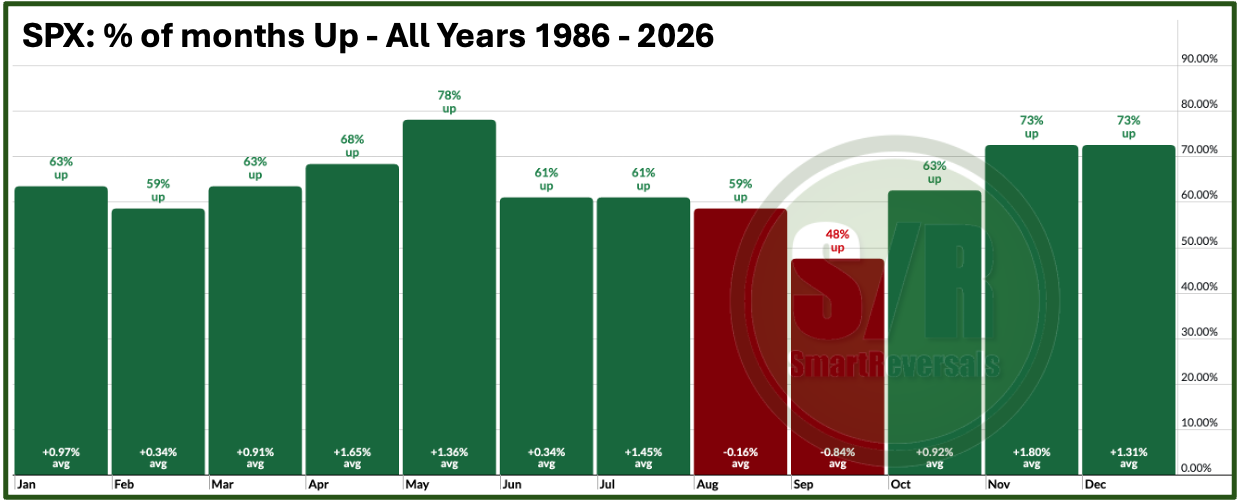
The S&P 500 is heading into a turbulent seasonal month. Over the last 40 years, the SPX has seen a positive close in September just 48% of the time. This is well below the 72% historical positive average that I mention as the benchmark based on the last 70 years; anything notably above or below that reference gains relevance. Worth noting as well, the average move for September over the past 40 years has been -0.84%.
A 48% win rate is a significant deviation to consider, and its relevance increases when you see that August is closing in the green this year. When I analyzed the years individually, many of the green Septembers were preceded by a red August, and vice versa, meaning that the window for a healthy pullback is narrowing. This volatile season is split in two months, with August green the odds of seeing volatility in September increase. See the two charts below:
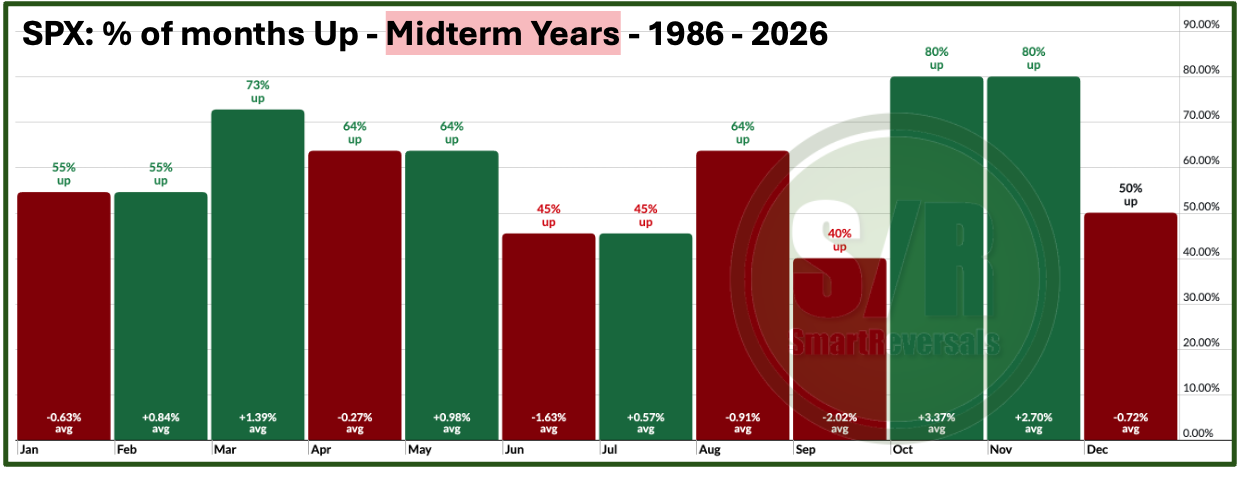
When analyzing only the midterm years, September has been positive 40% of the time, and the average move has been -2%. This is important context to consider before we study the charts below.
What could drive a negative move in September? When I study statistics, paid subscribers know that I like to understand the context alongside the individual charts, which is precisely what we are doing today.
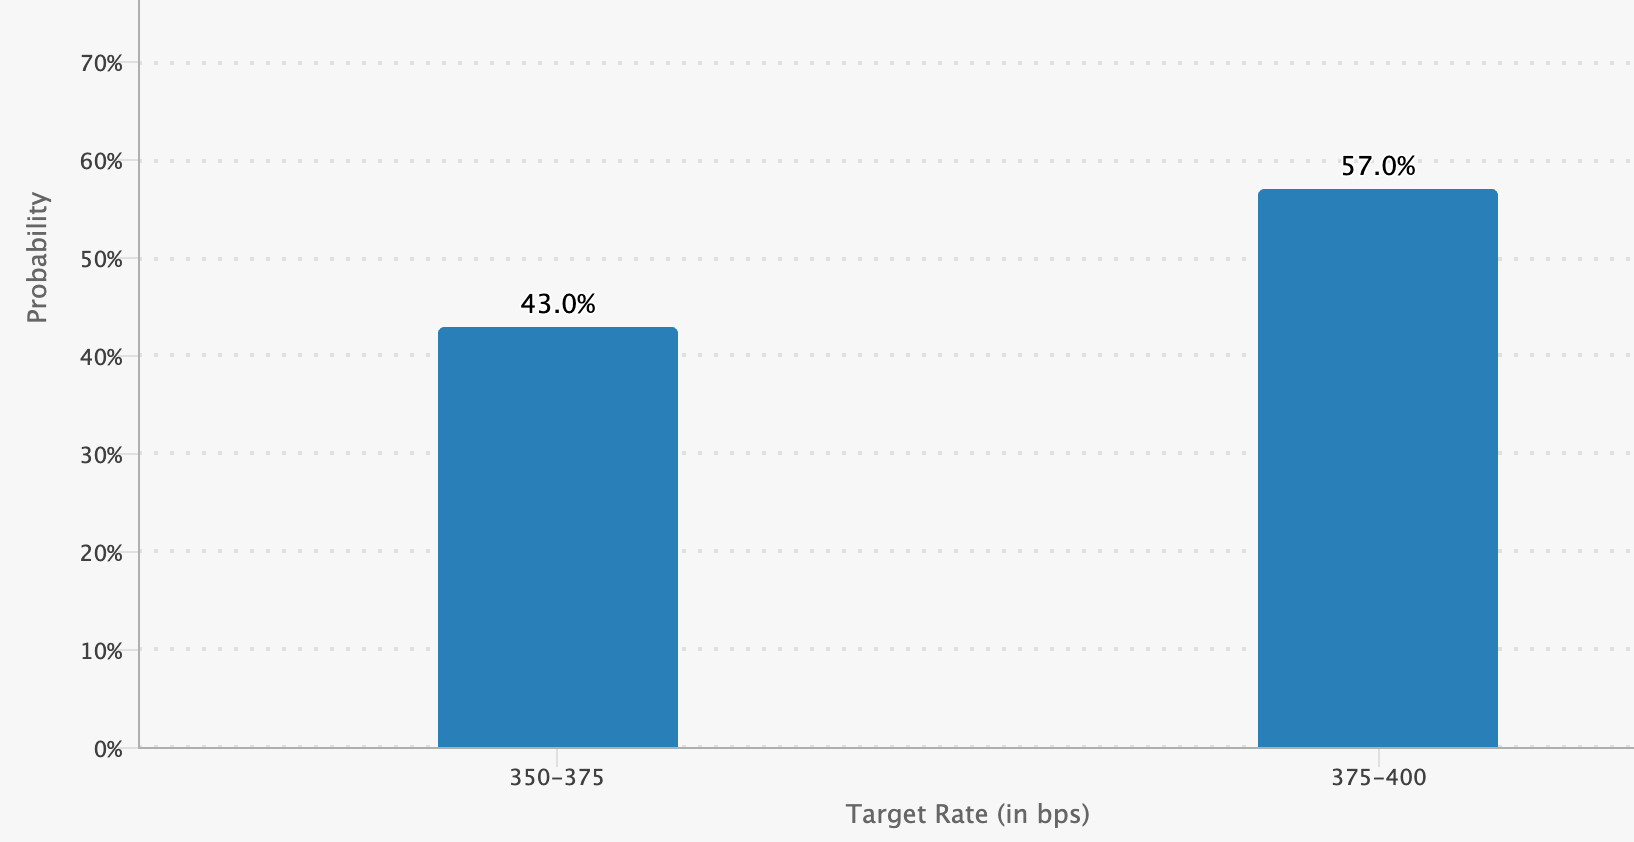
For general context in this instriduction, consider that just last Thursday, the probability of a rate hike in September was only 35%. After Kevin Warsh’s speech as the new Fed Chair in Jackson Hole, the probability jumped to 57%, as officially reported on FedWatch. That’s a major jump.
Today, we will review additional context regarding our technical charts, as they do not contradict a bearish move in September for several indices and stocks.
Is this a call for a general crash? No. I provide neutral analysis focused on a specific watchlist of megacaps and ETFs. These assets feature high market caps, ensuring this community is familiar with their fundamentals, alongside high daily volume that allows buy and sell orders to be filled quickly. This focus also ensures the availability of leveraged instruments, such as options and leveraged ETFs, for subscribers who use them to navigate the price action of well-known companies, indices or ETFs.
With that said, August has been a strong month for the bullish moves called in this publication with clear timing and price references, the SPX jumped the first days of the month (3rd and 4th of August), but the price has been stagnant in a narrow range for al the rest of the month, in the meantime, bullish calls posted in this publication have paid off in August: SPCX (is up +30% this month 🎯), GLD (+10% 🎯), TSLA (+12% 🎯), NFLX (+14% 🎯), PLTR +51% (navigating the post earnings rally 🎯), and others like Bitcoin 🎯 (up 23% so far in August). I provide the technical case alongside weekly and monthly central levels every week so traders and investors can manage risk according to their respective timeframes.
The week that just ended was choppy. When setups begin to lose their key levels and the bearish theses prevail, it serves as a warning sign. As expected this week according to the Setups Blueprint, AMD and SMH were bearish; both tickers reached their targets of 450 (-4,9% 🎯) and 544 (-2.9% 🎯) respectively this week. The expectation for a bearish move in XOM was validated as well with a -5% weekly move.
The updated setups are here, unlock which tickers are curling down favoring risk for bears, and which ones are likely to continue a bullish pathway using technical indicators and specific price levels. Upgrade to the paid plan here:
Subscribers also get access to educational content and Market Intelligence analyses, recent and how to get the most out of the high-probability setups or trade ideas posted here. Everything is available at smartreversals.com. Zero gut feeling. Everything is specific.

Today’s Agenda
Market Context: Charts+levels for SPX, Indices, ETFs, VIX, Breadth, and Crypto.
Deep Dive: Individual analysis with charts and targets for Mag Seven and setups.
Momentum Map: Analyzing the stage of every security in a single view.
Setups Blueprint: Entry levels for short and long setups with price targets and invalidation levels for all the securities in the watchlist prioritizing stronger setups.
Let’s begin.
SPX: Only a 40% Chance of a Bullish September, and the Charts Agree
Here is how you can manage the current conditions: