
Shooting Stars Across the Board
Bearish Sentiment is Emerging - How Do the Fresh Bullish Signal Presented on Wednesday and the Shooting Star Coexist? - Key Levels to Watch

A shooting star candlestick is a bearish reversal pattern that typically appears after an uptrend. It has a small real body (the thick part of the candle), which is at or near the bottom of its trading range, and its color is less important than its shape and position.
It has a long upper shadow (the thin line extending upwards from the real body) that is at least twice the length of the real body. This long upper shadow indicates that buyers pushed the price up significantly during the period, but sellers ultimately rejected the higher prices and pushed the price back down. Ideally, there is little to no lower shadow or wick.
While a shooting star on a daily chart can provide a valid signal, observing it on a weekly chart lends it greater weight and reliability as a potential indicator of a significant bearish reversal.
My publications on Saturdays consider longer than daily timeframes since they have more datapoints, a weekly or monthly candle encompasses in general five daily trading sessions (depending on holidays/weekend trading, or crypto/futures). This means it consolidates a much larger volume of price action and market sentiment into a single candle.
Shorter timeframes (like daily or intraday charts) are more susceptible to "noise" – random fluctuations, news-driven spikes, or algorithmic trading that might not reflect a fundamental shift in market sentiment. A pattern on a weekly chart filters out much of this noise, making the signal more robust.
When a shooting star forms on a weekly chart, it implies more conviction, since over an entire week, the market opened, attempted to push higher significantly, but was ultimately rejected by sellers, closing near the low of that week. This represents a stronger and more sustained rejection of higher prices by a broader range of market participants (institutional investors, long-term traders) than a rejection that occurs over just one day.
Case Study: SMH
The Semiconductor ETF provides a perfect illustration of a shooting star candlestick on its weekly timeframe. The black arrows in the chart highlight this formation, which historically preceded declines towards the 20 or 40-week moving averages, and even deeper corrections, as witnessed in April. The overbought oscillator further reinforces the potential for a pullback.
The volume shelf, originating from $231.2, is expected to provide substantial support. Any support level situated within this green volume-at-price shelf is inherently stronger than those outside it, whether above or below.
On Friday, June 6th, I published the support and resistance levels for the week ahead including SMH in over 40 securities. In that analysis, $249 was identified as the level dictating bullish momentum if the price remained above it. The bullish targets, or layers, were set at $259.5, which caused a temporary rejection on Monday, and $266.3, which indeed acted as a firm ceiling for semiconductors. Consequently, the price retraced from that zone, printing a weekly bearish candle.
The levels for next week were updated on Friday again. For access, click here: Key Levels to Manage Turbulence.
The price closed on Friday at $257, as highlighted with the black background on the right price scale in the chart below. This closing price is below the central weekly level for next week, which is $259 (bold and underlined). Therefore, if the price remains below this level, the shooting star formation gains further validation, and the next immediate target would be $253. While $255 might offer some monthly support, its proximity to Friday's closing price is notable. Moreover, this weekly formation typically precedes deeper corrections, as indicated by the red-transparent arrows in the chart.
If SMH successfully recovers its $259 key level (as some shooting stars serve as early warnings followed by a final spike before the actual pullback), $262 becomes the next resistance zone or target to assess for a potential bearish reversal.
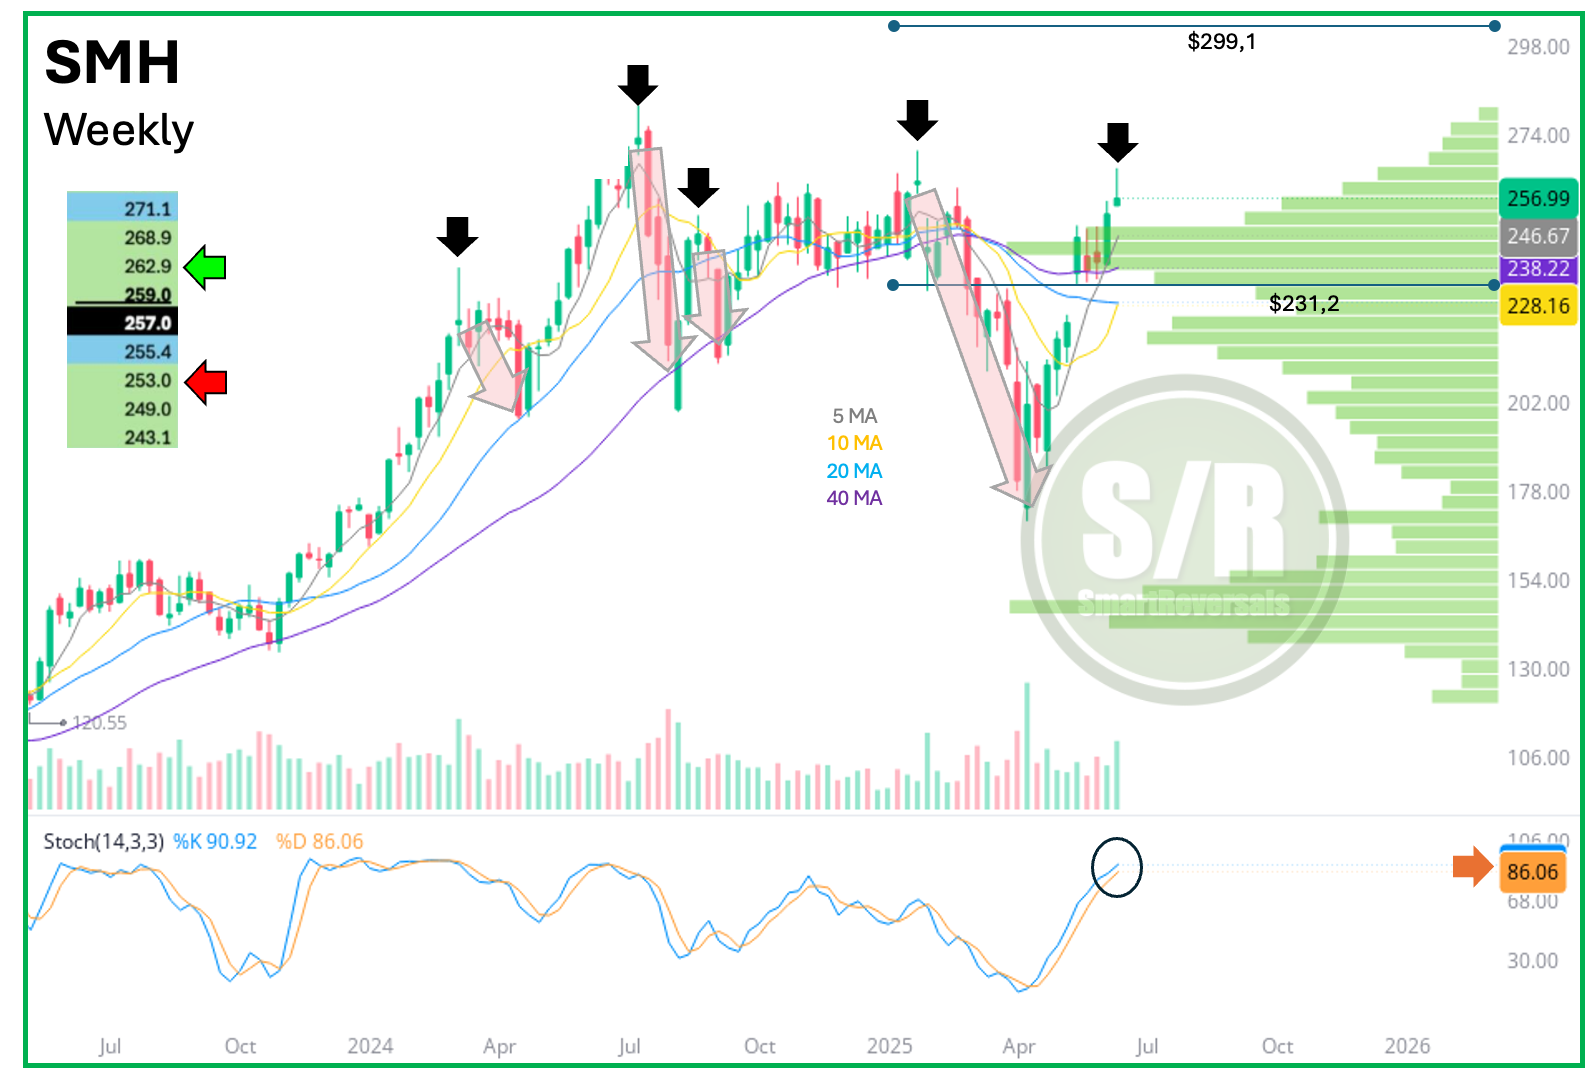
In general, the Semiconductor ETF has been presenting a series of lower highs since July 2024, when some semiconductors stocks peaked (MU, AMD), and others set a notable high that has been slightly surpassed before falling again for a consolidation (NVDA, TXN). Only Broadcom (AVGO) is setting fresh all time highs but also with a shooting star.
Educational content:
This shooting star formation can be studied along with others like the hammer, hanging man, doji, belt-hold/marubozu, inside/harami, and others, in the educational section at smartreversals.com. The specific edition with real life examples for the SPX, TSLA, AAPL, and other popular securities is here:
For educational content about the technical indicators mentioned, click on each link according to your interest: Stochastic and RSI oscillators, Candlestick patterns, Moving averages, and Support and resistance levels. Additionally, there are more indicators that I use in my regular analyses, such as Bollinger Bands, Volume Profile, and the McClellan oscillator. For the complete library, including studies of reversals and technical patterns in the stock market, click here.
Studying the markets using real world examples is much better than from an infographic with perfect-symmetric formations.
Upgrade your subscription to paid, and unlock all the analyses presented today and all the content available through the links. In the end, is father’s day weekend! give yourself or the father’s in your life the gift of knowledge. The educational content alone with the special studies are worth the subscription.
GOOG
Another example of a shooting star, in this case it found rejection at $176, a long term level that as of today is proving its strength, and considering how overbought is becoming the Stochastic oscillator, there are good chances to see a pullback.
A disciplined interpretation of technical indicators markedly enhances prediction probabilities. Nevertheless, even with the high degree of anticipatory accuracy demonstrated in my publications for premium subscribers—such as my February analyses forecasting an S&P 500 correction to $4800, my bullish analyses since April 9th, and the accurate peak calls for Tesla and Bitcoin in December, as well as for IWM during Thanksgiving weekend—I incorporate support and resistance levels for validation, thereby equipping premium subscribers with additional tools for superior decision-making.
That said, the bearish setup for GOOG is validated as long as the price stays below $177 next week, which is the central level updated, suggesting a descent towards $172. If Alphabet can re-establish itself above the $177.3 central weekly level, the price could target $181 before reversing.
It’s worth noting that similar shooting star candles were printed in November 2024 and January 2025, both presented bullish follow through for one and three weeks respectively, before notable pullbacks. (each security has its own “personality”, don’t take the 1-3 weeks as a rule for the SPX, TSLA, or other securities studied today).
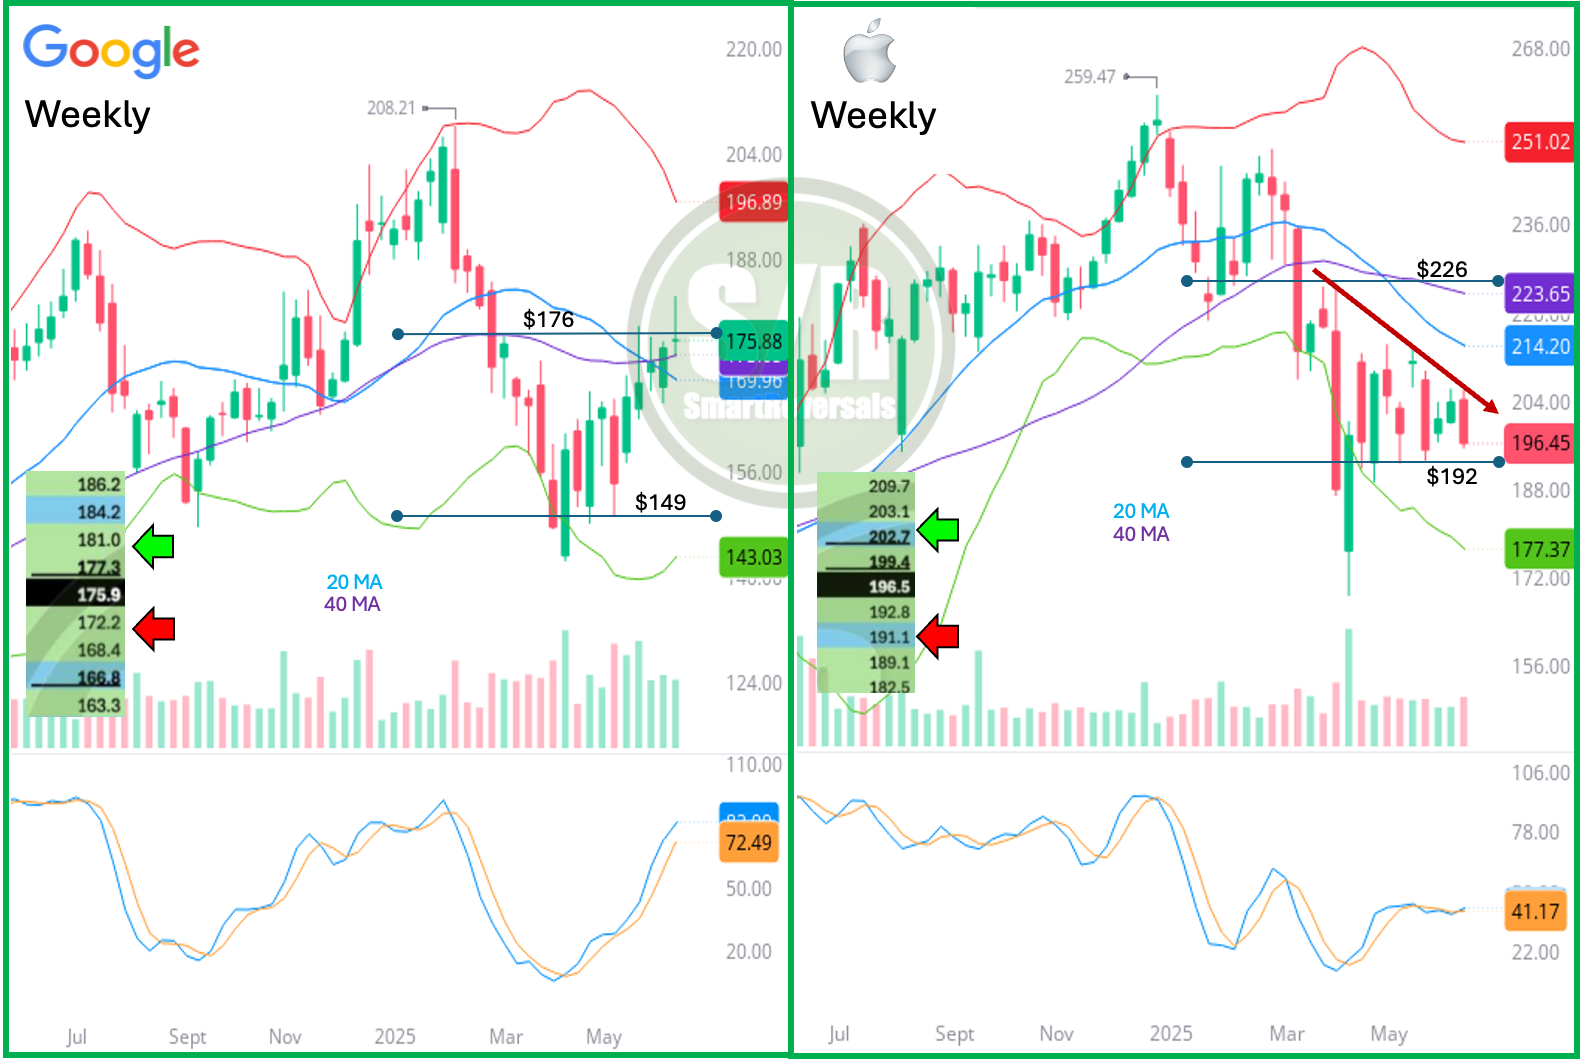
AAPL
The weakness in Apple is unparalleled; 2025 has presented a continuous downward trajectory, and over the last three months, a symmetric series of lower highs has been notably evident. Last week's candle initially suggested some continuation, but $203, which served as the central level for the week that just ended, acted with precision as resistance. The sequence of lower lows now strongly suggests that the $192 long-term level will be tested. As long as the price remains below $199.4 (the central level for next week), $192 is the immediate next destination.
Recalling yesterday’s educational content regarding support and resistance levels, when I wrote about starting from the long term picture and zooming in progressively, the broader picture reveals $192 as an annual level, with the monthly levels showing $191 as a line to watch. Furthermore, the immediate bearish level for the week is $192.8. This confluence indicates two key points:
$192 represents a confluence zone of annual, monthly, and weekly levels, suggesting it may act as support. However, this must be proven by price action.
The weekly candle shows conviction, and $192 is very close to the latest price. If the $192 zone is breached, a major resistance level would be established, and the world's third-largest company by market cap would continue to hinder the major indices from reaching all-time highs.
Conversely, if a Doji candle forms on Monday, or if an intra-week sell-off bounces and recovers $199.4, the price could then aim for $202.7. This is the monthly central level, which is currently acting as resistance and provides further reference for Apple's bearish momentum, as indicated yesterday in the educational content about combining monthly and weekly levels.
The Analysis Continues
The analysis for SPX, VIX, NDX, DJI, IWM, PLTR, NFLX, TLT, BRK.B, NVDA, TSLA, META, BITCOIN, AMZN, and MSFT continues. The following section offers a special observation for S&P500 and the stock market in general that reconciles the long-term vision shared in the latest study with the current weekly bearish signals. If you trade or invest in any of these securities, you'll find that the analysis maintains the same in-depth approach you just read for SMH, GOOG, and AAPL, focusing on the most relevant indicators for each security and providing specific price levels for validating setups and setting targets.
You don't need to trade every security; focusing on even a single security like the SPX, or a couple with this in-depth approach makes signing up for the paid plan worthwhile. The latest study that every trader and investor must read was posted on Wednesday:

Let’s continue.
SPX: How Do the Fresh Bullish Signal and the Shooting Star Coexist?