
Signals of Turbulent Waters Emerge - Confirmations Needed
Exhaustion signs in SPX and NDX - What are Gold and Silver Saying? - How to navigate the recent Bitcoin rally?


Staying alert is key in times of bearishness, but studying is even more important to avoid falling in the crowd and losing opportunities, or even worse, shorting against the trend with subsequent money losses.
NDX is raising a first sign of exhaustion, an orange alert I would say. Stocks like META declined as expected from the previous edition, AMZN and MSFT did not move constructively, and GOOG with TSLA are in the brink of annual supports recovered recently without conviction in the case of Google, and Tesla getting ready for a bullish move.
GDX and SILVER soared last week, it can signal several elements like economic uncertainty, when investors often turn to precious metals as a safe haven also during times of geopolitical turmoil, or market volatility. Another reason is when there are inflationary concerns, precious metals can be seen as hedges against inflation or expectations of higher inflation in the future. Currency devaluation (not only in U.S.) can also generate more demand for Gold or Silver. There is no good reason as you can tell.
On the other hand, Bitcoin soared above two resistance lines, an annual S/R level and a diagonal set by lower highs during the last months. Both studied in previous editions.
On the SPX side, I posted in this publication since August my bullish target for this bull leg: $5,885; the high of the week that just ended was $5,878. The level can be considered reached. The weekly chart below elaborates on what’s next.
Mixed Technical Signals, What about Macro Data?
Precious metals are raising yellow flags and NDX presents signs of exhaustion, but on the other hand IWM and Bitcoin soared suggesting continuation. This edition highlights the key elements that could trigger a sell signal for the indexes and stocks that are showing weakness.
Last week I published a unique guide to navigate and understand macro-economic indicators, I mentioned two installments since Core Retail Sales and Industrial Production were to be published after the publication, instead of that I published last Wednesday a fundamental analysis for banks, given the importance of their earnings for all the market. I got you, this is the update on the pending macro indicators:
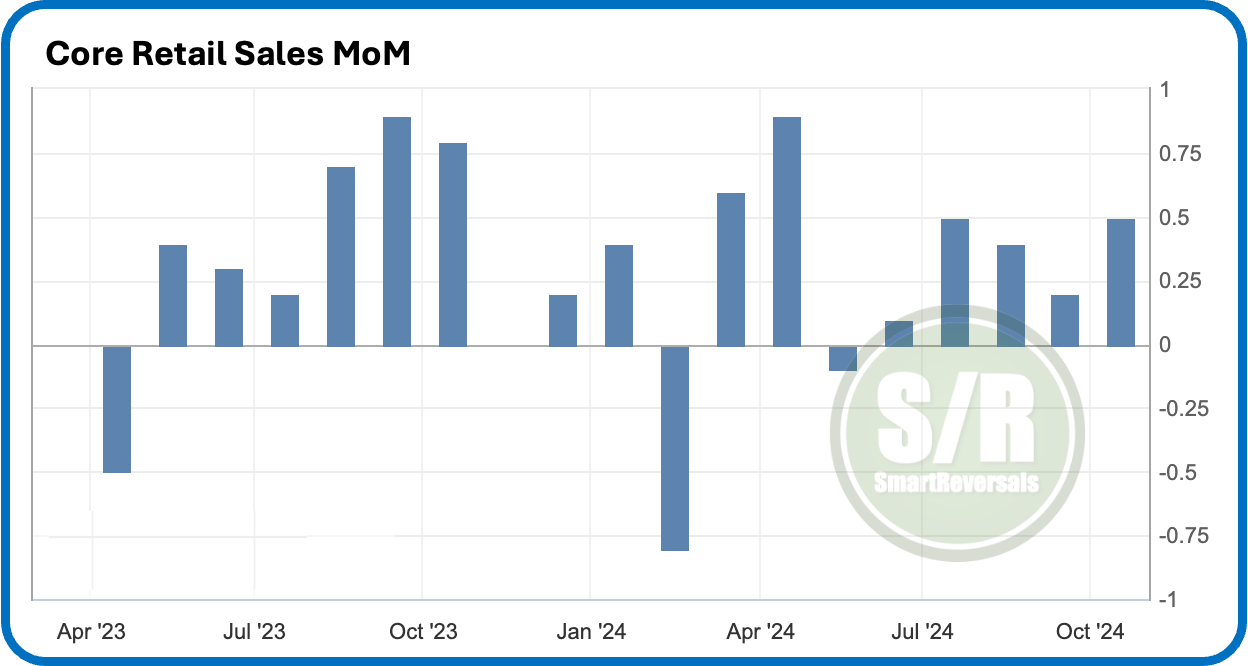
Core Retail Sales measure the overall spending on retail goods in the United States, excluding car sales. This economic indicator provides insights into consumer spending patterns and can be used to gauge the overall health of the economy.
The latest reading was bullish for the market, with a reading above consensus expectations. It is good for bulls who don’t want to see recessionary indicators and a subsequent market crash based on the recent rate cuts.
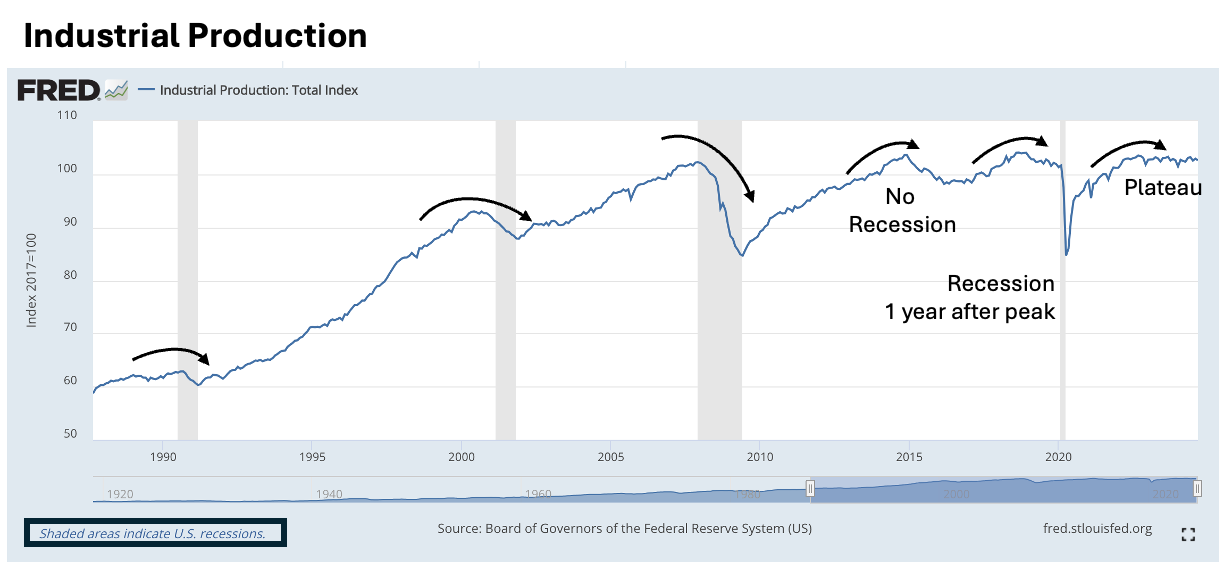
The Industrial Production continues in a plateau that is trying to curl down, the chart provides a visual of declines preceding or during recessions, it also shows cases without recessions like in 2015, or delayed recessions like the decline in 2019, followed by a recession after a year (and it was COVID). A curl down is not optimal, but don’t expect an immediate recession declared as the chart proves.
The Federal Reserve's monthly index of industrial production tracks the output of manufacturing, mining, and utilities sectors in the United States. These sectors are crucial drivers of economic fluctuations. The detailed information provided by this index helps us understand the underlying structural changes in the economy. The index measures the real output of all relevant US-based establishments, no matter their ownership.
To get access to all the macro-indicators and the warnings that are raised by the inverted yield curve and the Sahm Rule, plus 10+ macro indicators explained in a friendly and concise way, use this link:

As a summary: Macro Indicators suggest caution, also the rally in precious metals, while Small Caps and Bitcoin soared. Let’s study what the weekly charts say for SPX, NDX, DJI, IWM, AAPL, GOOG, TSLA, MSFT, AMZN, NVDA, META, GDX, Silver, Bitcoin, and the Commodity Index. The edition as usual includes market breadth and contextual indicators.
SPX - $5,885 can be considered reached
Last week in an ocean of bearishness, this weekly chart anticipated no signals of a pullback, this is what the chart says today after reaching a key resistance zone anticipated since August: