This short week that just ended suggests an invalidation for the bearish setup brewing during the end of June.
This edition of the S/R levels comes longer than usual for two reasons:
Providing general context of what is influencing this overextension.
Sharing in advance to the weekly compass the SPX and NDX charts, since the weekend newsletter will be published on Sunday evening for this time.
Liquidity: A significant reason for the overextension
Historical lows in recommendations for cash allocation by wall street strategists
The decrease in the average cash allocation recommended by Wall Street strategists implies more liquidity flowing into stocks. Liquidity generally benefits stocks by increasing trading activity, reducing price volatility, and potentially driving prices higher due to higher demand.
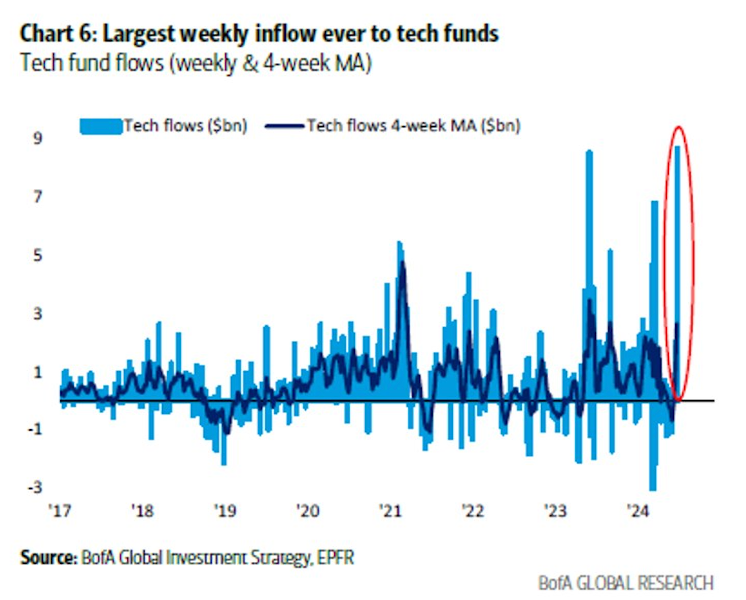
Historical highs in inflows to tech and growth funds
The following two charts are from the end of June, they may work for contrarians, since when the crowd jump in euphorias the outcome is usually opposite to the trend, however the last week suggests a happy outcome so far.
High liquidity in growth and tech stocks can benefit the stock market in several ways:
1. Efficient Pricing: High liquidity allows for smoother and more efficient trading of growth and tech stocks, ensuring that prices more accurately reflect market conditions and investor sentiment.
2. Increased Investment Opportunities: Investors are more likely to find opportunities to buy or sell growth and tech stocks quickly and at fair prices, which can attract more capital to these sectors.
3. Market Stability: Higher liquidity can help maintain market stability by reducing the impact of large buy or sell orders on stock prices, mitigating sharp price movements.
However, high liquidity in growth and tech stocks can also pose risks:
1. Speculative Trading: Excessive liquidity can attract speculative trading activities that may lead to inflated stock prices or market bubbles in these sectors.
2. Overvaluation: If liquidity-driven demand outpaces fundamental value, growth and tech stocks may become overvalued, increasing the risk of a market correction.
3. Volatility: While liquidity can reduce price volatility in the short term, sudden shifts in liquidity conditions can also amplify volatility, especially during market downturns.
Overall, while high liquidity in growth and tech stocks can bring benefits to the stock market, investors should be cautious of the associated risks such as speculative bubbles, overvaluation, and increased volatility. It's essential to maintain a balanced and diversified portfolio to navigate potential market fluctuations effectively.
That said, the weekly shooting star above the higher Bollinger band with overbought oscillators has been invalidated so far, not for technical reasons, macro is important and liquidity is a key driver.
Before jumping into S/R levels, let’s study the weekly charts for SPX and NDX, since this weekend the Weekly Compass will be published on Sunday evening.
Weekly SPX Chart


