


U.S. stocks closed mostly higher on Tuesday as cooler-than-expected inflation data and strong bank earnings relieved pressure on Wall Street, overshadowing ongoing geopolitical tensions and a major corporate profit warning.
The June Consumer Price Index (CPI) report showed that annual inflation slowed to 3.5%, cooler than the 3.8% economists had projected. A 9.7% drop in gasoline prices helped pull headline inflation down, easing investor anxieties about potential interest rate hikes from the Federal Reserve.
The S&P 500 (SPX): Gained +0.4% to close at 7,543.59. At yesterday’s close, I shared the price levels where institutional algorithms were likely to react today; 7,529 served as our central daily level (CDL: bullish above and bearish below) with resistance at 7,551. I also noted that while it is not a formal technical indicator, early-week volatility has recently tended to reverse. True to form, the open was highly volatile, as shown in the 15-minute SPX and QQQ charts below. By framing the candles based on their closing prices, you can see that the SPX moved within the 7,529 to 7,551 range.
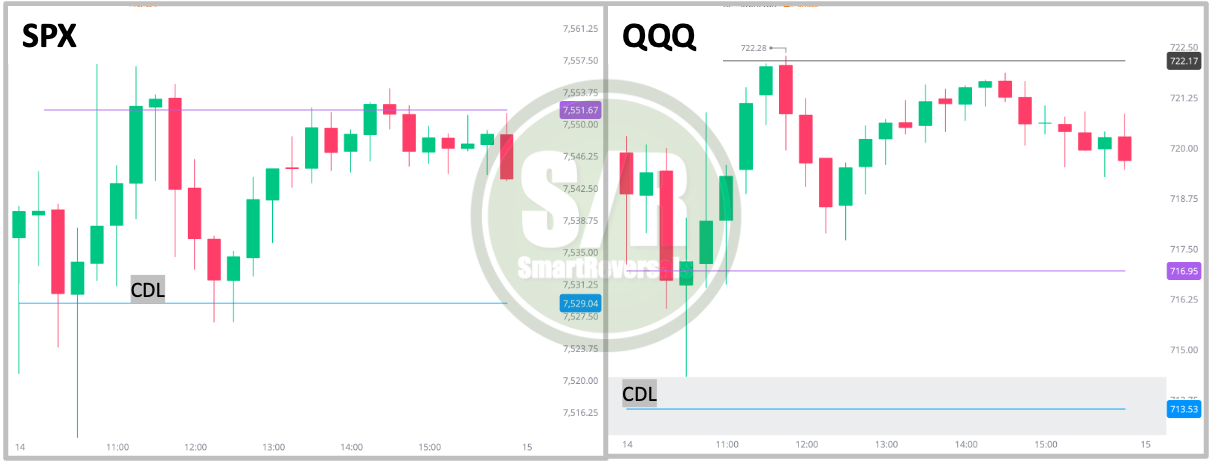
Given the internal divergence and lack of synchronization across the Magnificent Seven, semiconductors, and software, technology remains our primary focus today. To navigate this, I provided specific central daily levels (CDL) for QQQ, SMH, and IGV yesterday, setting our bullish above / bearish below levels at 713, 589, and 92.5, respectively. Each CDL was accompanied by corresponding support and resistance zones. The chart above presents in the 15 minute timeframe for the day, QQQ shows how the price stayed above the CDL (713), and moved between 716.9 and 722 during the day.
Interestingly, in the software sector (IGV), we observed a strong bounce from 90.5; the price climbed to 91.6, recovered the 92.5 CDL by 9:45 AM, and then consolidated at 93.7, a level provided well ahead of the session.
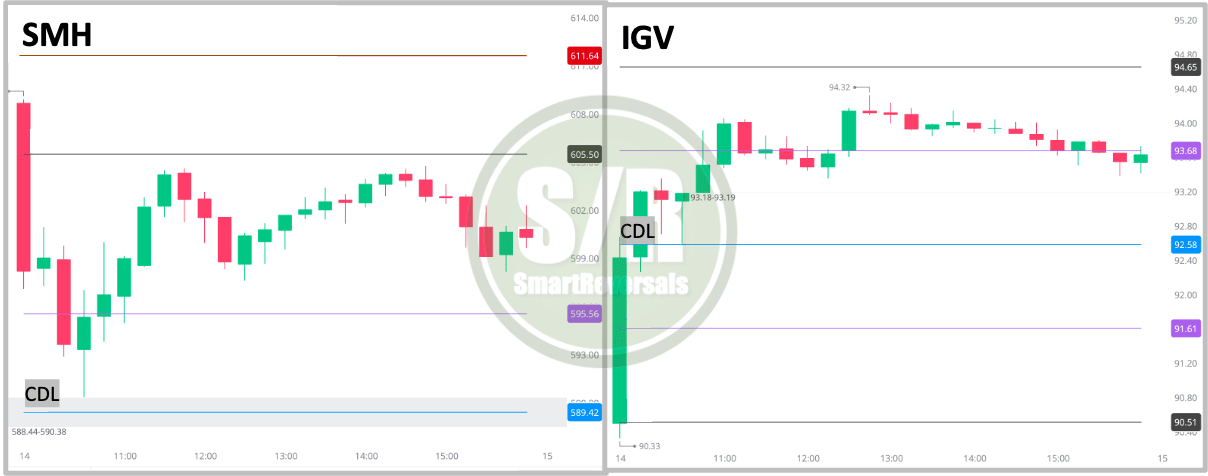
The divergence is impressive, while software was bouncing, semiconductors (SMH) were declining, in this case the CDL was held during the day as support, and the price moved between 595 and 605.
All the lines displayed in the four charts above were provided in yesterday’s publication. Having these levels plotted before the market opens provides a significant edge for any trader. I provide those lines combined with weekly levels so you can anticipate confluence zones.
Below, you will find the updated daily levels for tomorrow. Paid subscribers receive daily SPX levels for every upcoming session. Founding members gain access to that same level of granularity for ETFs, the entire Magnificent Seven, semiconductor leaders, and other major megacaps. Subscribe now to unlock this market intelligence.
Identifying Major Reversals: A Case Study in SMH and IGV
Before we dive into the daily levels for the SPX and key ETFs for tomorrow, this educational piece will help you anticipate the probabilities of a recovery like the one we observed in IGV today, alongside the retracement seen in SMH: