


A gap represents a distinct break in the price action of an asset’s chart. It occurs when the price of an asset opens at a significantly different level (either higher or lower) than its previous day’s closing price, with no trading occurring in the price range between the close and the open.
Visually, this creates an empty space or “hole” on the chart, which is often highlighted by traders (as seen in the yellow boxes on your chart). Gaps typically occur when significant news, earnings reports, or economic data are released while the market is closed, leading to a sudden shift in supply and demand before the next trading session begins.
Price action is generally considered a continuous flow. A gap interrupts that flow, meaning that not every price level between the previous close and the new open was traded.
From a technical analysis perspective, this skipped price range represents an area of “inefficiency” or a “vacuum” where normal buy and sell orders were momentarily absent.
Why are they usually “filled”? (And why do algos fill them?)
The phrase “filling the gap” means that the asset’s price subsequently moves back into the empty price range created by the initial gap.
There are several market-based reasons why this often occurs:
1. The “Price Vacuum” Effect: As mentioned above, the price range within a gap has not been “auctioned” or tested. When the price retraces back to this level, it is often met with less resistance because there were few, if any, prior orders executed there. This makes it easier for the price to traverse that specific zone.
2. Profit Taking and Retesting: Often, a gap is caused by an emotional, one-sided move (e.g., panic selling on bad news or euphoria on good news). Once the initial momentum slows down, traders who profited from that move may start taking gains, causing the price to pull back. This pullback naturally gravitates toward the last known price point before the emotional move occurred; the pre-gap closing price.
3. Algorithmic Trading (Algos): Modern markets are dominated by algorithmic trading systems. Many of these algos are programmed to recognize technical levels like the ones update every week here, including unfilled gaps. Algorithms often treat these empty zones as “imbalances” or “liquidity voids” that need to be corrected.
Algos may act as a stabilizing force by aggressively buying into an oversold gap down (anticipating a reversion to the mean) or selling into an overbought gap up. This systematic trading pressure helps facilitate the move back to “fill” the gap.
With all that said, today’s move improved the price structure we have been tracking during the week. However, the question is not IF but WHEN will the gap at 7,657 will be filled for the SPX; the chart below highlights with a yellow rectangle gaps printed by bullish moves during the last months, see that sooner or later they were filled. The one opened on May 5th had bullish continuation with a +4% move before a rapid flush happened in the beginning of June wiping out the bullish move. The same happened with the gap opened on August 4th, with the price gaining 2.5% during the next days until the move was completely wiped out by September 10th.
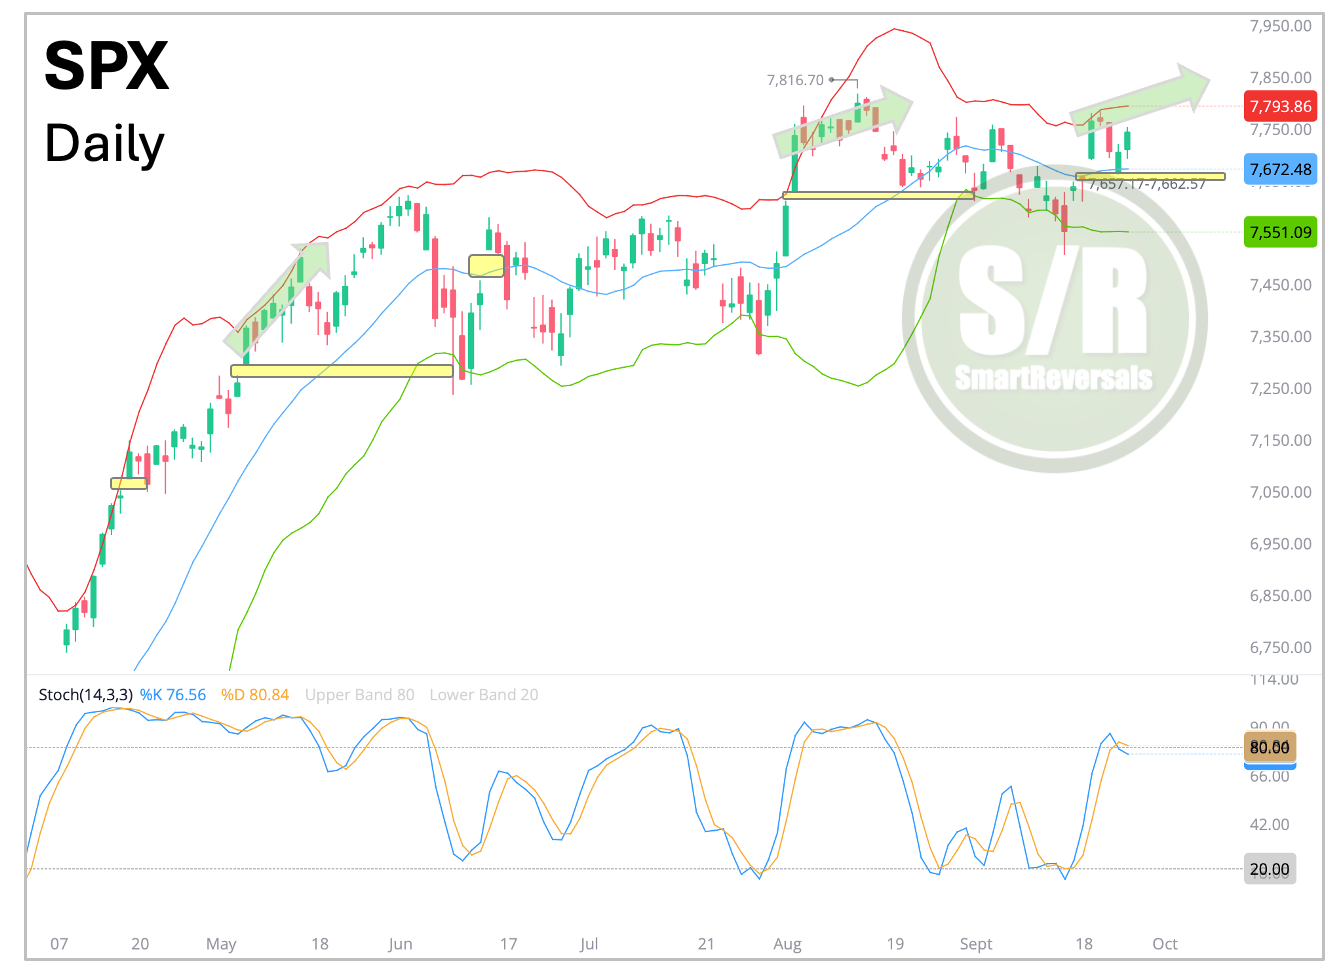
Will this time be different for the SPX? No, it won’t. We will navigate the move aware of this magnet which the sooner it gets filled, the better for bulls. From here the clock is ticking for any bullish move, and the way how we have navigated price action has been with the modeled support and resistance levels. We didn’t wait for a -4% loss in June, the central weekly level of that week at 7,559 was breached on June 5th triggering bearish momentum capital and gains protection from a bearish move that bottomed at 7,237. Same case on September 8th when the central weekly level of that week at 7,651 was breached (as anticipated), protecting capital and gains from a drawdown to 7,507.7
The central weekly level (CWL) and the layers around where institutional algorithms react are modeled every Friday for you, providing the information needed to assess risk and reward before the market opens on Monday. You don’t have to wait for the opening bell to decide your plan and which securities to trade; you have here the distances to essential levels and the setups suggesting whether they will act as support or resistance well in advance, so you make informed and serene decisions ahead of Monday morning. Subscribe to the paid plan and unlock the levels for next week for every ticker in our watchlist.
Our Core Watchlist:
Indices & Futures: SPX, NDX, DJI, IWM, ES=F, NQ=F
ETFs: SPY, QQQ, SMH, TLT, GLD, SLV, DIA, VXX
Major Stocks: AAPL, MSFT, GOOG, AMZN, NVDA, META, TSLA, SPCX, LLY, WMT, AVGO, COST, JPM, XOM, PLTR, NFLX, V, AMD
Crypto & Related: Bitcoin, Ethereum, ETHA, IBIT
Leveraged ETFs: TQQQ, SQQQ, UDOW, SDOW, UPRO, SPXS, URTY, SRTY
If you trade or invest in some of these securities, this publication is for you.
When you upgrade to the paid plan, you unlock three core publications each week, along with exclusive member benefits:
→Wednesday: Market Intelligence and fundamental analyses.
→Friday: Support and Resistance Levels for the week ahead.
→Saturday: The Weekly Compass, featuring an in-depth technical immersion.
In addition to our weekly publishing schedule, your membership includes three immediate advantages:
→ Instant Ebooks Access: Download my two foundational technical analysis ebooks directly from the Market Intelligence Library. (click here)
→Daily SPX & ES=F Levels: Receive daily levels assessing short-term momentum and potential reversal signals.
→Customized Level Modeling: Every Sunday, submit your watchlist stocks in the paid subscriber chat. Their specific institutional levels are modeled for the week ahead and published directly to the site.
All content is available at SmartReversals.com.
Today’s Content:
Weekly Levels for the Watchlist
Monthly Levels for the Watchlist
Combined Levels
Daily Plan for Monday (SPX and ES=F)
Let’s begin.
WEEKLY LEVELS
The distance to the CWL next week is tight for the SPX and the e-mini futures, and stocks like NVDA, AMZN, GOOG, and TSLA, are among the ones that are already with bearish flags. On the other side SMH, PLTR, and AMD look strong. The levels around the CWL for each security is where institutional algorithms react: