SPX Hits Overbought Territory as NDX Overheats
Can Technology Alone Sustain the Rally as Market Breadth Deteriorates?


The Value of Objective Discipline: Navigating a +16% Rally
On March 28th, this publication anticipated how oversold the S&P 500 was, based on three essential technical indicators. Premium subscribers were able to see the confluence of these metrics and the high likelihood of a bounce, a move that was confirmed once the Central Weekly Level (CWL) of 6,458 was recovered. This occurred on Tuesday, March 31st, as the S&P 500 rallied 2.9%. Additionally, I introduced my Founding Members' daily levels for all subscribers. These provided an early bullish signal as long as the price remained above 6,362, offering an extra layer of validation, earlier entry for longs, and enhanced risk management.
Because a gap was left open that day, I published a specialized “Wednesday Study” providing an objective analysis of the risks involved. By highlighting gap behavior following extreme oversold conditions, using 50+ years of data dating back to 1970, I demonstrated that these gaps are structurally normal. This study proved essential for navigating the initial gap at 6,349 and the subsequent gap at 6,618 on April 7th.
Neutral, objective technical analysis and the disciplined study of patterns are the best ways to navigate this market. I save you that burden by providing these deep dives, and premium subscribers can always ask me to study specific major events.
Technical Clarity Over Market Noise
When the market was characterized by apathy, I provided an essential reference during the week that ended on April 10th: the significance of 6,816. This, (a key moving average) was statistically and historically studied to confirm its relevance under those market conditions. As you know, my preferred timeframe is the weekly chart, which removes the “noise” of daily volatility.
When the price opened above that essential weekly average during the week of April 17th, premium subscribers recognized the reality of the recovery. The S&P 500 subsequently delivered its third weekly rally, gaining +4.5%. Following this, I analyzed the “Three Weekly Soldiers” pattern (three consecutive weeks of +3% gains) and its historical tendency to lead into consolidations. Using data since 1970, I showed that if a pullback happened, the setup remained fundamentally bullish, and here we are.
Current Conditions and the Fed Transition
Recently, there has been significant noise regarding the risk of a new Federal Reserve Chair. Last Wednesday, I provided an analysis showing the pullbacks that have followed those events, considering magnitude, time, and as always, technical indicators forming a pattern. Having navigated this +17% rally with discipline and neutrality, we are finally reaching indicators that compare with historical consolidations.
I have mentioned different studies posted during this rally, you can access all of them in my Market Intelligence hub, always visible in the SmartReversals site. There are more studies that are worth the subscription for long term investors and traders.
Preparing for the Week Ahead
My study on Saturdays involves a consistent set of securities, starting with the SPX, NDX, and Dow Jones, continuing with key ETFs such as SPY, QQQ, DIA, IWM, SMH, SLV, and GLD. The analysis covers the full Magnificent Seven, other mega-caps like AVGO, JPM, LLY, PLTR, and WMT, Bitcoin, and essential volatility and breadth indicators. Every ETF and stock in this publication includes the critical weekly and monthly levels required for precise navigation. Last week alone the bullish moves for GOOG and TSLA were posted with specific price targets, $397 for GOOG was reached with precision. Long term moves are also navigated, in addition to the SPX and NDX, my bullish call for Bitcoin has been sustained during all these weeks, for a +18% gain.
These levels are modeled every Friday for the week ahead, providing the clarity needed to assess risk and reward before the market opens on Monday. Rather than waiting for the opening bell to build your plan, you receive the distance to key levels and technical setups, suggesting whether they will act as support or resistance, well in advance. This allows you to make informed, calm decisions before the trading week begins.
Today, we will analyze the current state of the S&P 500, the Nasdaq, the implications of semiconductors in this overextended rally. We will also look at the Dow Jones and what it is saying, Small Caps, and individual names.
Subscribe to unlock every setup. All charts include specific targets and invalidation levels designed to help you manage risk and protect capital in a volatile market. We will now begin our deep dive into the mega-cap universe, the major U.S. indices, and the technical signals driving the current trend.
Today’s Agenda
Market Context: Charts and price levels for SPX, U.S. Indices, Volatility, Breadth, and Crypto.
The Momentum Map: Analyzing the stage of Indices, the Magnificent Seven, Crypto, and other megacaps in one easy-to-read chart.
Deep Dive: Individual analysis of Metals and Mega Caps (20+ charts).
Setups Blueprint: All setups condensed with price targets and invalidation levels for all the securities in the watchlist prioritizing higher probability setups.
Let’s begin,
Market Context
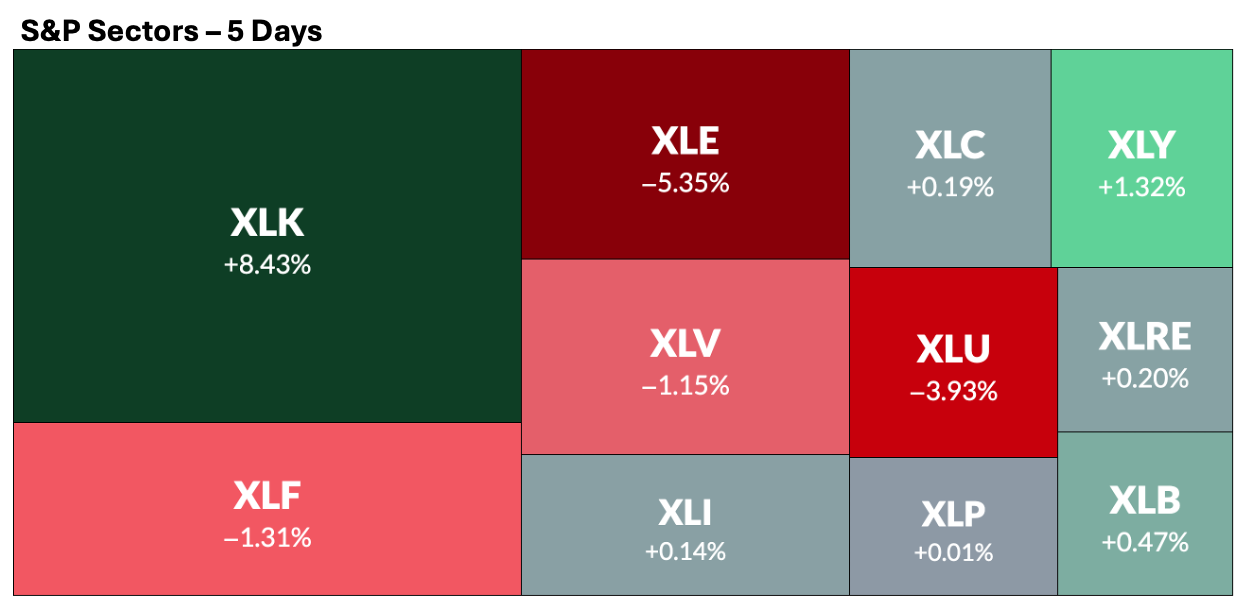
After studying the recent rally and the likelihood of its continued bullish momentum, we are beginning to see a significant deterioration in stock participation. A sector-level analysis reveals that last week’s move was driven by Technology and Semiconductors. While Energy declined, consistent with geopolitical news and the drop in oil, Utilities, Healthcare, and Financials all closed in the red, losing more than 1%. Other sectors remained neutral, with the upside being heavily influenced by Technology and Consumer Discretionary (specifically AMZN and TSLA).
With Financials and Healthcare under pressure, the critical question is: how much more room does Technology have to run?