
SPX: This Is Why the Bearish Move May Continue
Daily levels for SPX, Special Chart to watch


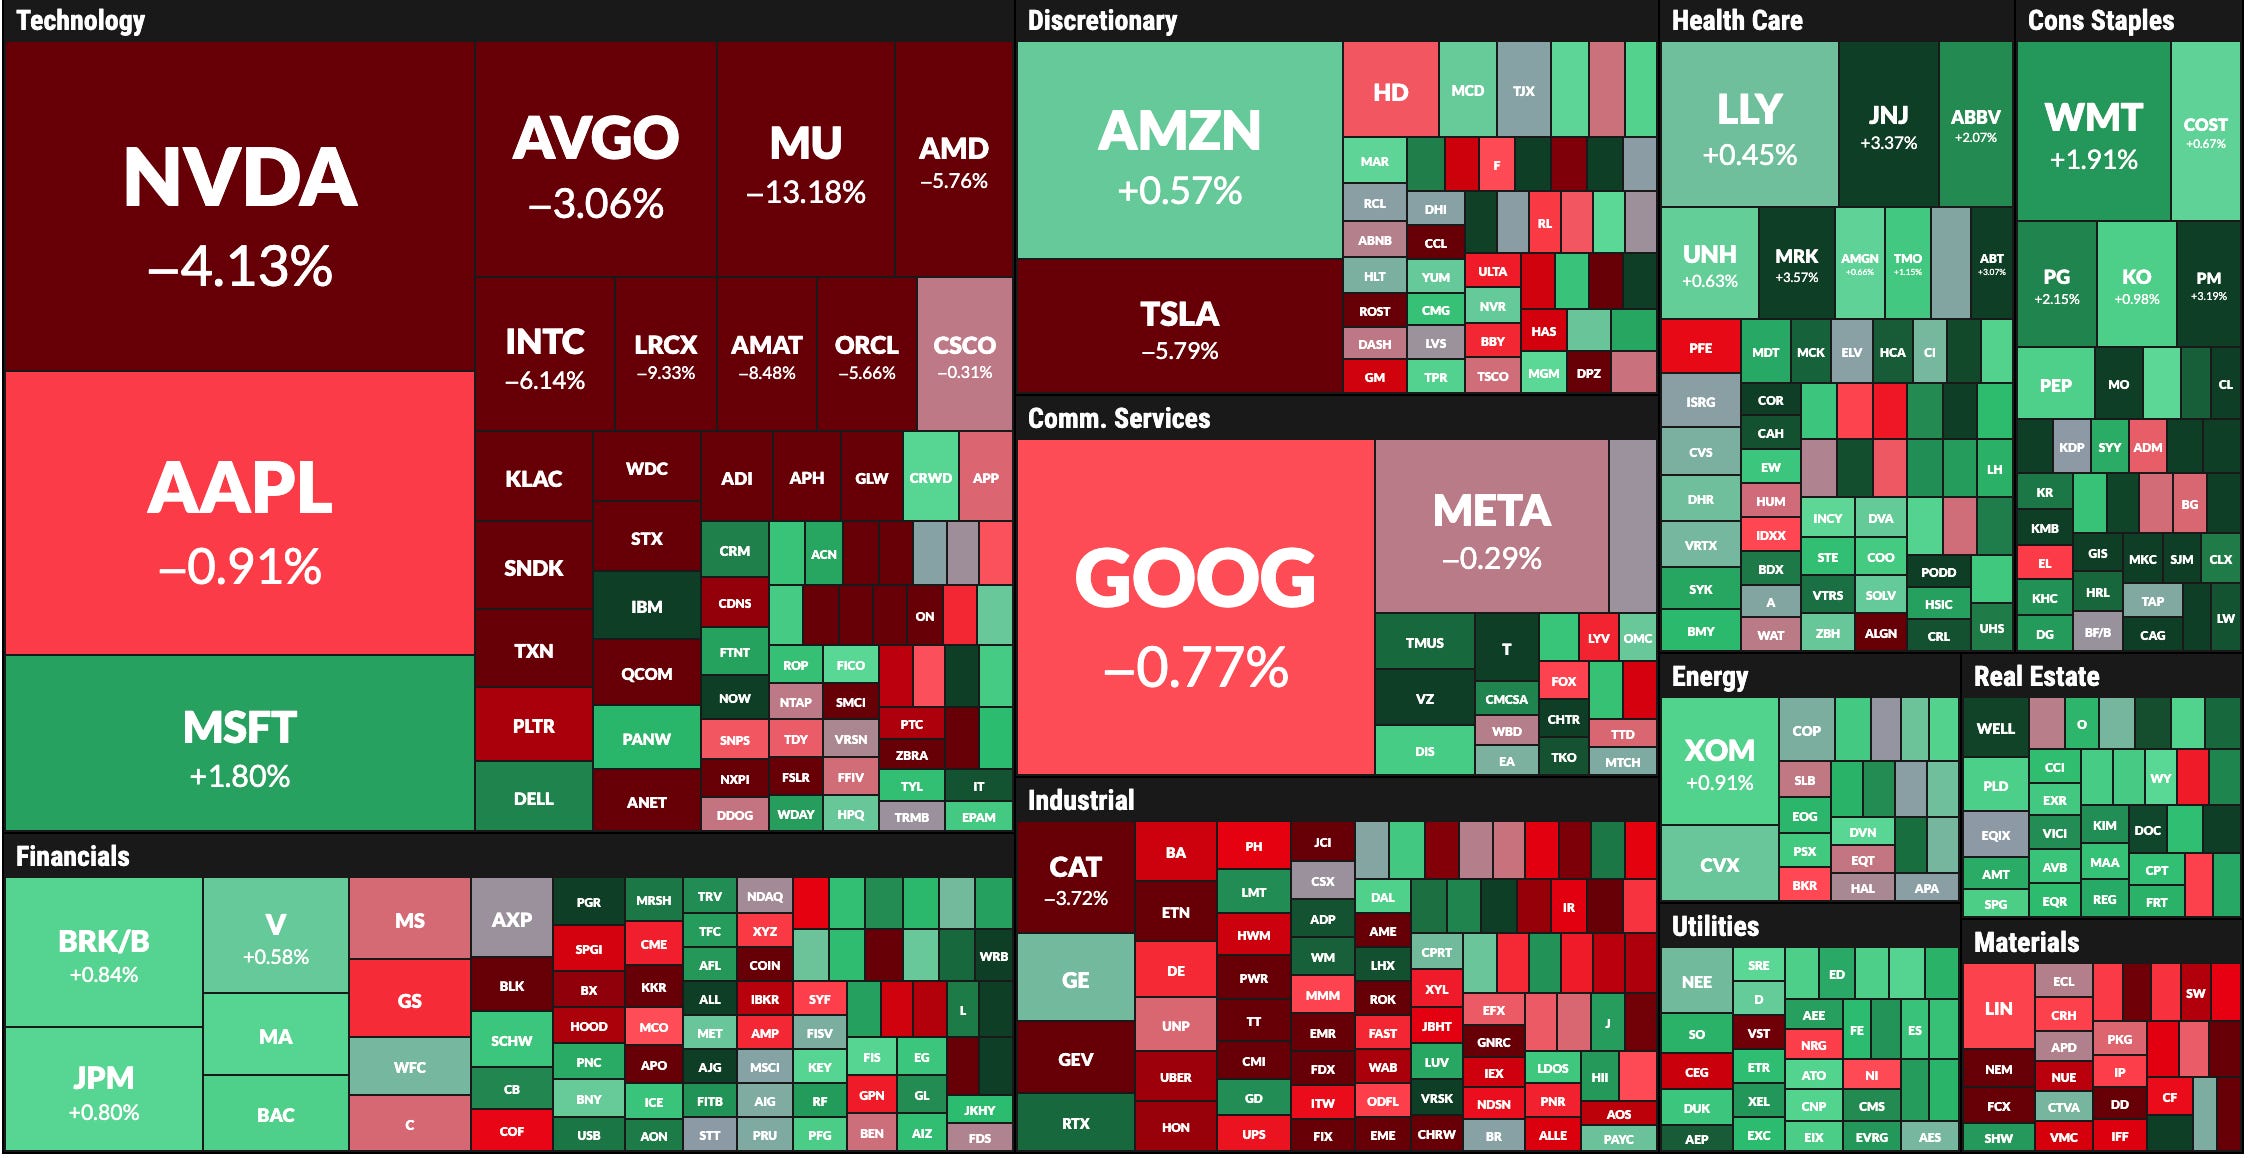
The technology sector fell today, driven lower by semiconductors and individual names that had become technically overextended during the recent rally. As warned over the weekend, underlying cracks in the SPX were already visible through weakening market breadth and an over dependence on the semiconductors space.
Major names like MU, AMD, ORCL, INTC, LRCX, QCOM, and TXN fell sharply. The rotation into non-tech sectors was insufficient to contain a broader decline that began after the SPX hit my annual target of 7,620. This target was provided to paid subscribers months in advance through disciplined technical analysis.
For the record, I anticipated the high likelihood of a bounce on March 28th in the Weekly Compass, my orientation is neutral and focused on technical indicators using levels to validate reversals.
SPX → Daily Moves:
As highlighted last night, the SPX entered a position of weakness after losing our central weekly level of 7,493 on Monday. Today, the index gapped down at the open, bounced momentarily to 7,417, and then continued its selloff down to 7,375, both daily levels modeled ahead of today’s price action.
The daily levels for the SPX are posted here, along with a key technical chart that suggests the pullback is not over, even if there is a bounce tomorrow.
Unlock the content by subscribing to the paid plan, the levels for SPCX are also modeled here.