
S/R Levels for the Week Ahead: Feb 17-21
The week closed in the green, and indices like SPX presented indecisive price action on Friday at a key resistance level.

The support and resistance (S/R) levels, provided every Friday in advance of the following week's trading, have become an indispensable tool for traders. Price action demonstrably respects these levels, tending to fluctuate within their boundaries. This pattern, consistently observed throughout 2024, continues to hold true this year.
The comprehensive technical analysis, published for indices, stocks, commodity ETFs, and crypto; helps traders assess the probability of bullish or bearish moves, anticipating the likely direction of price action.
The S/R levels provided on Fridays are designed to encompass these anticipated price movements. Crucially, they also identify critical thresholds: levels above which price action suggests a bullish bias, and levels below which a bearish bias is indicated.
The chart below showcases the accuracy and predictive power of these levels, highlighting how they have contained price action in recent weeks. It's important to reiterate: these levels are published before the week's trading begins, offering a proactive edge. As you can see in the chart, the actual price movements have largely adhered to the S/R zones we identified in advance.
Key elements in the chart:
Grey boxes: These highlight the typical weekly trading range.
Black lines: These represent the first resistance and support levels.
Blue line: This marks the central, or key, level. Price action above this level suggests a bullish bias, while price action below indicates a bearish bias. This has proven to be a highly effective indicator.
Red and green lines: These depict subsequent support and resistance levels, also provided every Friday.
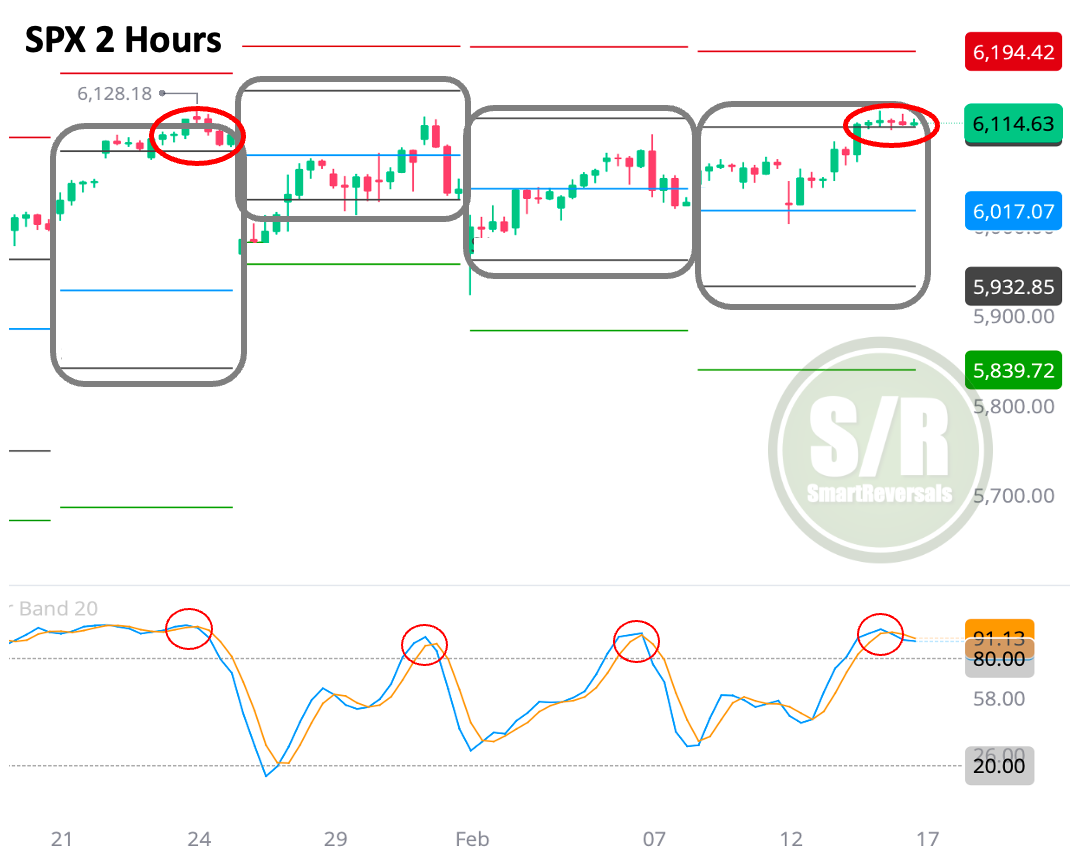
Combining these levels with candlestick patterns and oscillators gives traders a significant advantage. Note, for example, the overbought conditions and subsequent pullbacks.
Crucially, recent price action shows five consecutive indecisive candles, beginning Thursday afternoon. This underscores the accuracy of the short-term bullish target provided for the past week.
Finally, the central level acted as a perfect support this week, resulting in a bounce. Currently, the bearish stochastic crossover mirrors the technical conditions observed on January 24th, which preceded a market pullback. See the red tick circles.
The analysis every week provides these levels for the following securities:
SPX NDX DJI ES=F NQ=F SPY QQQ IWM DIA SMH TLT TQQQ SQQQ UPRO SPXS UDOW SDOW URTY SRTY NVDA META MSFT AMZN GOOG AAPL TSLA NFLX COST MSTR PLTR AMD GLD SLV BITCOIN ETHEREUM. If you trade some of those securities this publication is for you.
Subscribe, and unlock the levels for next week, here are the examples for AMD and NFLX.
AMD: Bullish continuation if $112 continues as support || Immediate target for bullish continuation: $115.8 || Potential bearish reversal target if $112 is breached: $109.3
NFLX: Bullish continuation $1040.5 holds price || The next upside target is: $1082.6 || Potential bearish reversal target if $1040.5 is breached: $1016.5
WEEKLY LEVELS FOR 35 SECURITIES: