
S/R Levels - June 17th - 21st
Weekly levels updated for the usual securities, and the closest annual ones included for SPX, DJI, NDX, BTC, ETH, SPY, IWM and QQQ.


Key levels in times of overheated technicals
Every week these levels are updated so you can plan ahead your trades or most importantly, you have the central of seven S/R levels that acts as validator of significant reversals.
The 4 hours chart with the levels provided during the last two months provides references of price action when the central or blue level is lost.
As highlighted in red, when that level is breached, a change in the trend happens.
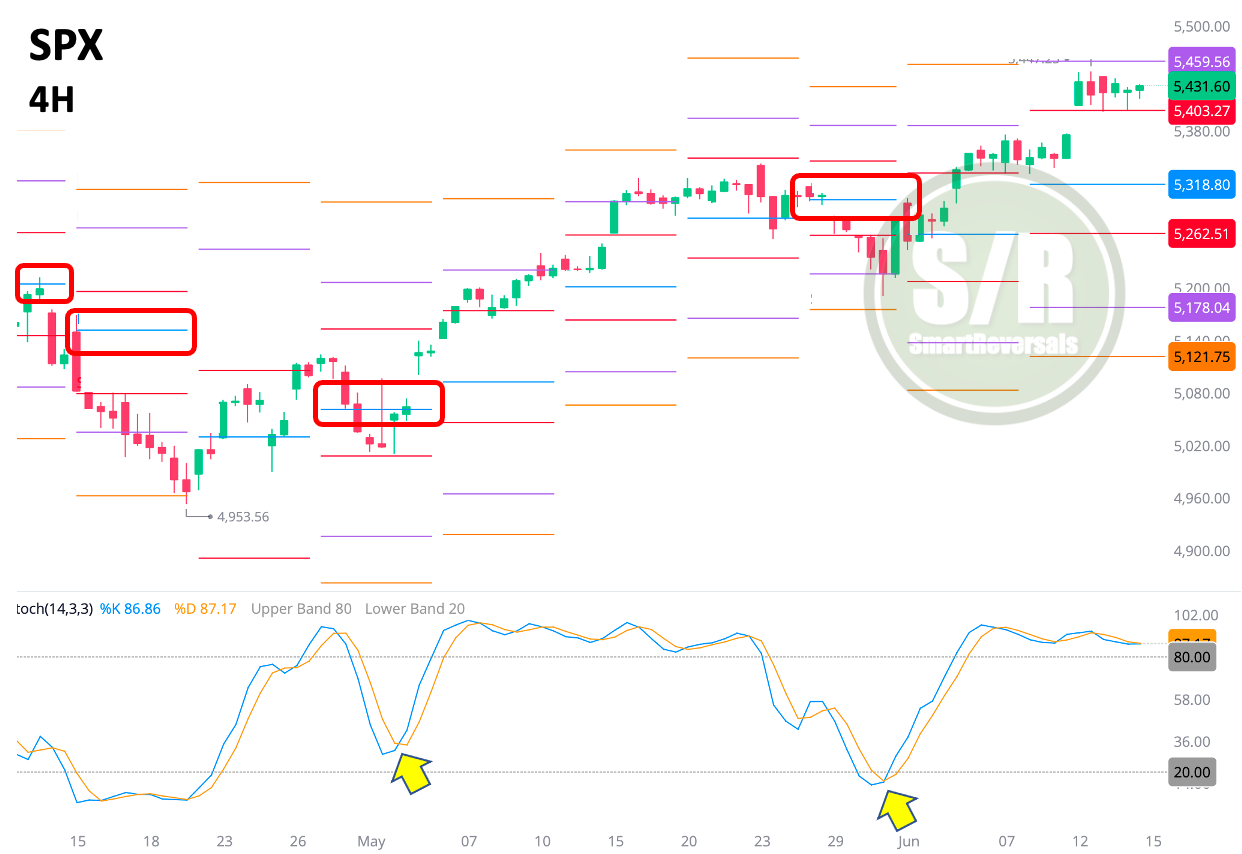
As with any support and resistance level, price can cross a level momentarily, that’s what is called the "Spring" period of the Wyckoff Method. I will include this in the coming educational editions.
That’s why some traders set stop losses with some distance from the S/R level used.
Remember to use S/R levels with other technical indicators, the second yellow arrow indicates the latest reversal moment validated by Stochastic. It happened two weeks ago when I posted it on X at 1:30 PM when the setup was ready.
We will learn if the pullback expected was delayed by the CPI news, bear in mind that Dow Jones and Russell2000 did fall during the week. Let’s keep track of the central levels and price action when price is moving above or below for SPX and NDX .
This edition includes the annual S/R levels for several equities permanently tracked, I added Bitcoin and these annual levels thanks to your feedback.
WEEKLY LEVELS