
S/R Levels - June 3rd - 7th
Weekly and Monthly Levels Updated - Plan ahead your trades using seven levels to read price action moves in every timeframe. Securities Included: SPX SPY NDX QQQ IWM DJI TSLA NVDA ES=F NQ=F GDX & more

Golden Tool Updated for June and Next Week
The updated weekly and MONTHLY levels are updated here, these levels help you determine potential reversals or consolidations.
On Friday, May 31st; after a hostile morning I saw the 30 minutes, 1 and 2 Hours charts and price action was suggesting a bounce, hence my post on social media suggesting a potential reversal based on the 2HRS candle $5216, which was a WEEKLY and MONTHLY level, elevating the relevance of that line. For SPY the equivalence was $520.
The hammer candle passed that level and SPX soared more than 1% after that signal; that’s the relevance of these levels.
During the last two weeks my educational content has been focused at Price Action, which is nothing more than candles and volume. These lines help to read candles and volume as I just did it during market hours and posted in social media as follows:
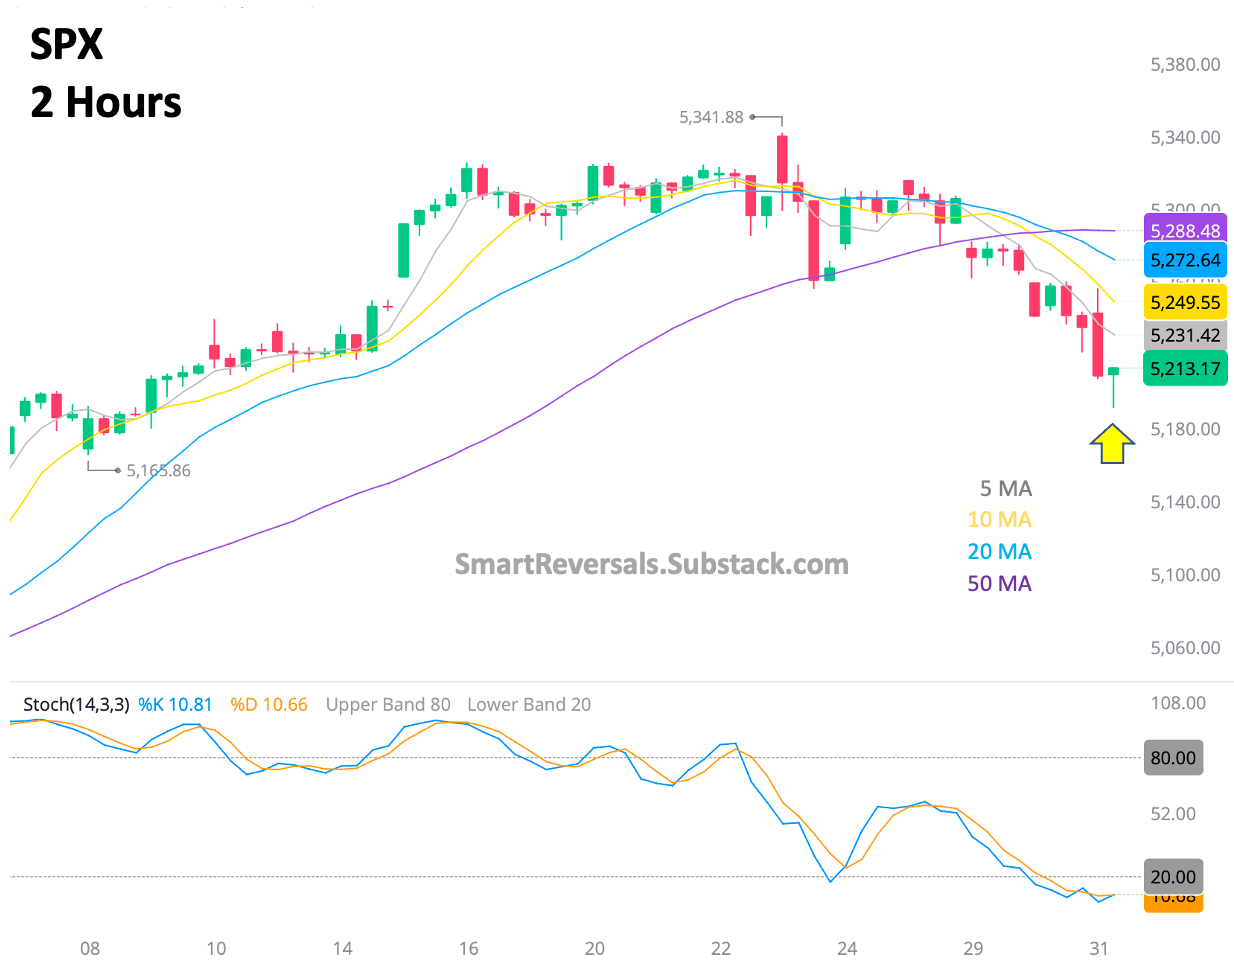
$SPX - 2 Hours Chart:
The thesis of a technical bounce today faded quickly in the morning for this index, but the technicals that suggested support are still in play and working for DJI and IWM (Lower band and 50DMA respectively). Worth nothing the current formation in 2 hours chart, that candle is bouncy and oscillators are oversold. $5216 has to be recovered to consider a bounce. the formation opens up that possibility. For SPY $520
Here is the latest educational content for price action, check it out! and there is a third edition coming next Wednesday.


Here are the Weekly and Monthly Levels: