
S/R Levels - May 28th - 31st
Plan ahead your trades using seven levels to read better price action in every timeframe. Securities included: SPX, NDX, DJI, SPX, QQQ, IWM, ES=F, NQ=F, NVDA, TSLA, AAPL, Oil, Silver, GDX, and more!


Oscillators, Bollinger Bands, Moving Averages, Volume Profile and many technical indicators help to read price action and decipher probabilities for trend direction and trend reversals.
Using Support and Resistance levels is essential to anticipate confirmations that most technicals would provide at a slower velocity.
Some people subscribed after I sent the email yesterday with content for everyone, so here is the link for that open for everyone publication, it provides education about capital inflows and outflows to Utilities, Infrastructure and Technology.

The thesis of a top being in is still valid, so here are the central S/R levels for 20 securities including Futures and all the tech mega-caps that define the bullish and bearish zones for each one, with three levels above and three levels below useful to measure potential falls or reversals.
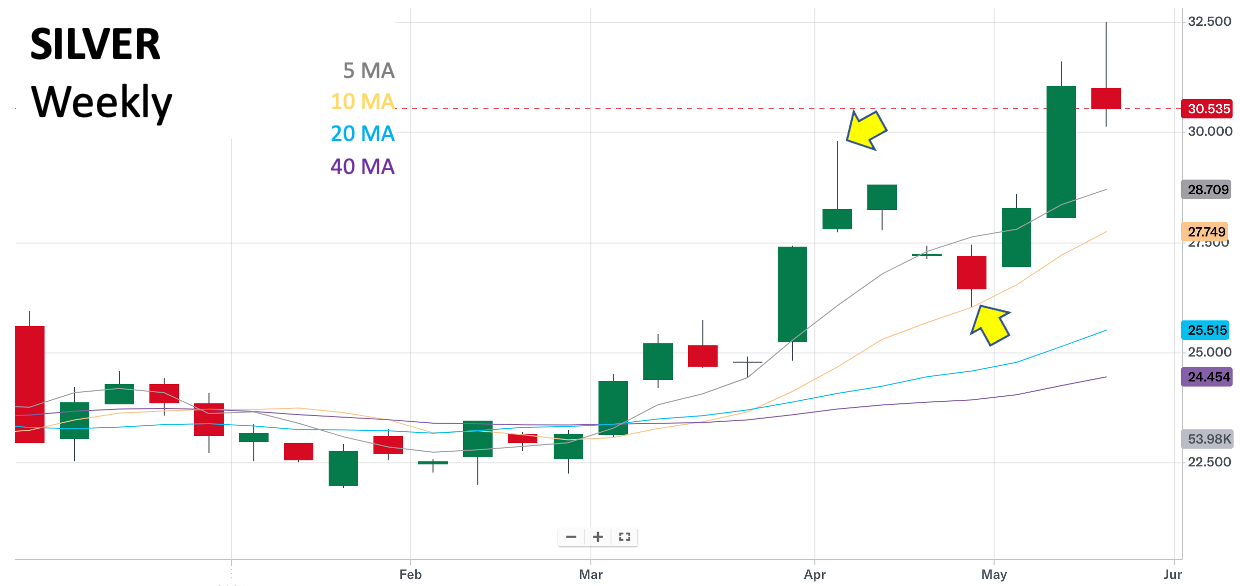
When I was preparing the levels for next week I saw a chart that looks pretty much like a top, and if you like to trade commodities you saw how Crude Oil and GDX fell during the week, one as expected, the other as the break below the central S/R indicated.
I hope you’re drawing these lines in your charts so you can evaluate price action better, they will be very useful next week since the NVDA and GME (For SmallCaps) will be less impactful, in the end the big moves happened already. It’s time to see what happens next: