
Stealth Ahead of Rate Decision
Next Week is More About Agile Felines, Less About Bulls and Bears


Last week, the SPX printed a bullish engulfing candle that opened the door for bullish continuation. Given the deteriorating stock participation, I provided five key indicators to watch; if their thresholds were breached, a market pullback could be triggered. I combine technicals with specific price levels to avoid premature decisions, as any true reversal needs confirmation.
Giants like AVGO, GOOG, ORCL, and AAPL kept the NDX and SPX afloat last week while the percentage of stocks falling below their 50 daily moving average increased, this conditions continued through the first half of this week, and by Wednesday, the Dow Jones and the Volatility Index were on the verge of validating a pullback. However, the VIX reversed exactly from 15.3, the precise threshold I identified to differentiate between bullish and bearish conditions for the broader market.
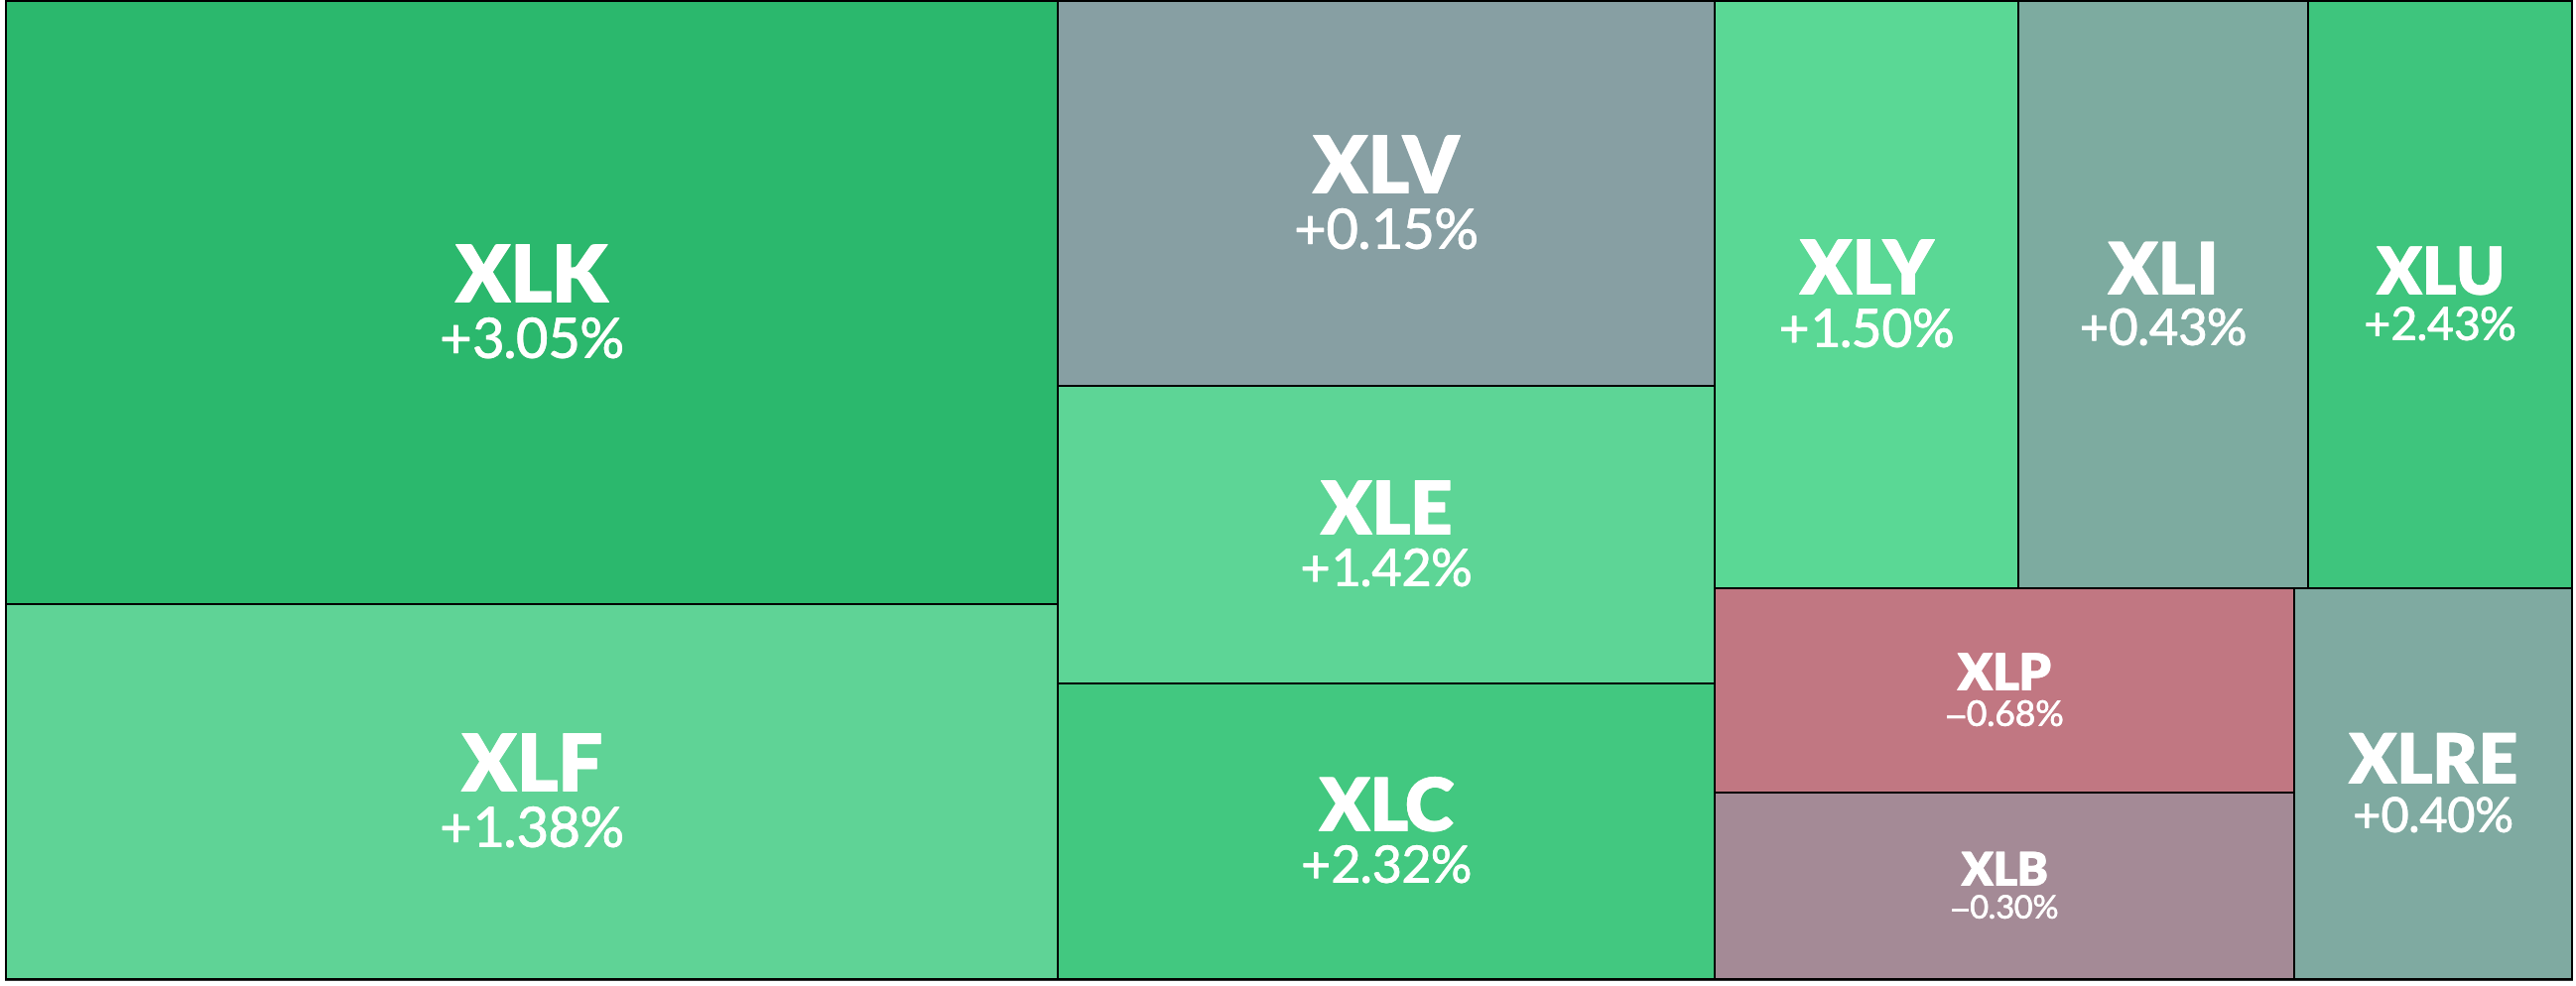
By Thursday, many stocks bounced, improving the breadth indicators we track. This wasn't a rally driven by a few tech giants; hundreds of stocks participated, including AAPL, TSLA, BRK.B, and WMT from our permanent watchlist. This broad strength helped the SPX consolidate above the key $6,486 level. The stock participation was so broad that all 11 S&P sectors finished with a green week. The heat map below summarizes this price action for the last five trading days.
The market has behaved consistently with the 90%+ up-day signal from August 22nd. As compared with previous occurrences in the Market Intelligence publication (linked below), this bullish overextension is following the impulse this signal has historically anticipated.
Each security analysis in this publication uses a specific framework of price levels: a central weekly level, three layers of resistance, and three layers of support. This modeled structure has proven remarkably accurate at framing the price action for all securities.
For example, last week's bullish setup in SLV suggested a first target of $37.8, which was hit on Monday. As the bullish momentum continued, the price quickly consolidated above $38.3 by mid-week and approached the third resistance layer at $39.0 by the week's end.
NVDA provides another strong example. Last week's analysis anticipated a bounce due to daily oversold conditions. Indeed, the stock bounced near $171.6 on Monday and revisited that level with more conviction on Tuesday. By Thursday, the rally had reached nearly $179.9 before pulling back.
Similarly, the analysis for TSLA included the $393.0 level as part of its anticipated weekly framework. The stock validated this by closing on Friday just three dollars above that mark.
My point is that these levels give you an edge, defining likely targets as long as the price stays above the central weekly level (for resistance targets) or below it (for support targets).
For the week ahead, this central level will be key for all securities, especially ahead of the FOMC meeting, the publication with the S/R levels for next week can be reached in the link below, it was posted yesterday. Make sure to read it, I described a significant signal that traders and investors must consider for the coming months.
For new Subscribers, the current price levels in the market were anticipated when there was a lot of fear and my studies posted pointed to a new bull market, my bullish stance continues, while giving you the tools to manage a potential healthy pullback. The following price levels have been in my charts since April, in consistency with my studies, they have been all reached:
$6,486 for SPX 🎯
$122,7K for Bitcoin 🎯
$521 for MSFT 🎯
$177 for NVDA 🎯
$220 for GOOG (recently surpassed) 🎯
$173 for PLTR 🎯
$1,250 for NFLX 🎯
$299 for SMH 🎯
$46,300 for Dow Jones 🎯
$23,654 for NDX 🎯
Let's dive into the charts for SPX, VIX, NDX, DJIA, IWM, SMH, SLV, GLD, WMT, BRK.B, NFLX, PLTR, GOOG, AAPL, TSLA, NVDA, META, MSFT, AMZN, and Bitcoin, along with our breadth analysis.
The purpose of analyzing these 20 securities is to present diverse opportunities. When indices are quiet, individual stocks can shine—like TSLA's bullish setup last week, which played out well, or PLTR's bounce after recovering its central weekly level.
I will update the five indicators that kept us from shorting the market last week. If they are finally breached, caution will be warranted.
SPX and General Stock Market
The rotation chart below summarizes the relative market moves over the last 10 weeks, highlighting several key trends:
Lagging securities like WMT and BRK.B are now showing relative strength against the SPX.
PLTR is attempting to move from the weakening quadrant back to a leading position.
TSLA and AAPL are awakening, with Tesla validating my bullish call last week.
Metals (GLD and SLV) continue to exhibit persistent strength.
This chart provides a high level summary that complements our deep dive analyses of individual technicals and price levels. This detailed approach helps us navigate trends and anticipate key tops and bottoms: