
Stocks to Record Highs Fueled by Labor Data
Key Setups for Next Week and What the Breakout Means for the Sector Rotation.

The U.S. stock market wrapped up the first full trading week of 2026 on a high note, with the S&P 500 clinching a fresh record close and solidifying a winning week. All major indices advanced, led by the Dow Jones (+2.32%) and the Nasdaq 100 (+2.22%), which outperformed the S&P 500 (+1.57%). This strong performance, particularly the Dow’s leadership, was consistent with the price action and technical analysis highlighted in this publication last week.
Friday’s session was primarily driven by a mixed December employment report that investors ultimately interpreted as a signal of underlying economic resilience. Nonfarm payrolls increased by 50,000 for the month, falling short of the 66,000 forecast, while downward revisions to prior months removed 76,000 jobs from previous estimates. Despite the headline miss on job creation, the unemployment rate ticked down to 4.4%, defying expectations for it to hold steady at 4.5%. This data portrays a labor market that is cooling rather than collapsing. It preserves the narrative that the Federal Reserve has room to continue its rate-cutting cycle to support growth in the first quarter.
Corporate and policy headlines fueled significant divergence in specific sectors, particularly technology and housing. Intel shares surged 10% after President Trump touted the government’s profitable equity stake in the company, a move that sparked a broader rebound across chip stocks. Simultaneously, homebuilders such as D.R. Horton and KB Home rallied on prospects of lower borrowing costs. These gains followed reports that the administration is considering a $200 billion purchase of mortgage-backed securities, a proposal that pushed mortgage rates to three-year lows and reignited interest in the housing sector.
5 Day Gains per Sector:
Last week, we observed strength in the Energy, Materials, and Utilities sectors, accompanied by significant declines in Technology, Financials, and Consumer Discretionary. This week, however, the movement in the stock market has been broad, with most sectors participating in the rally.
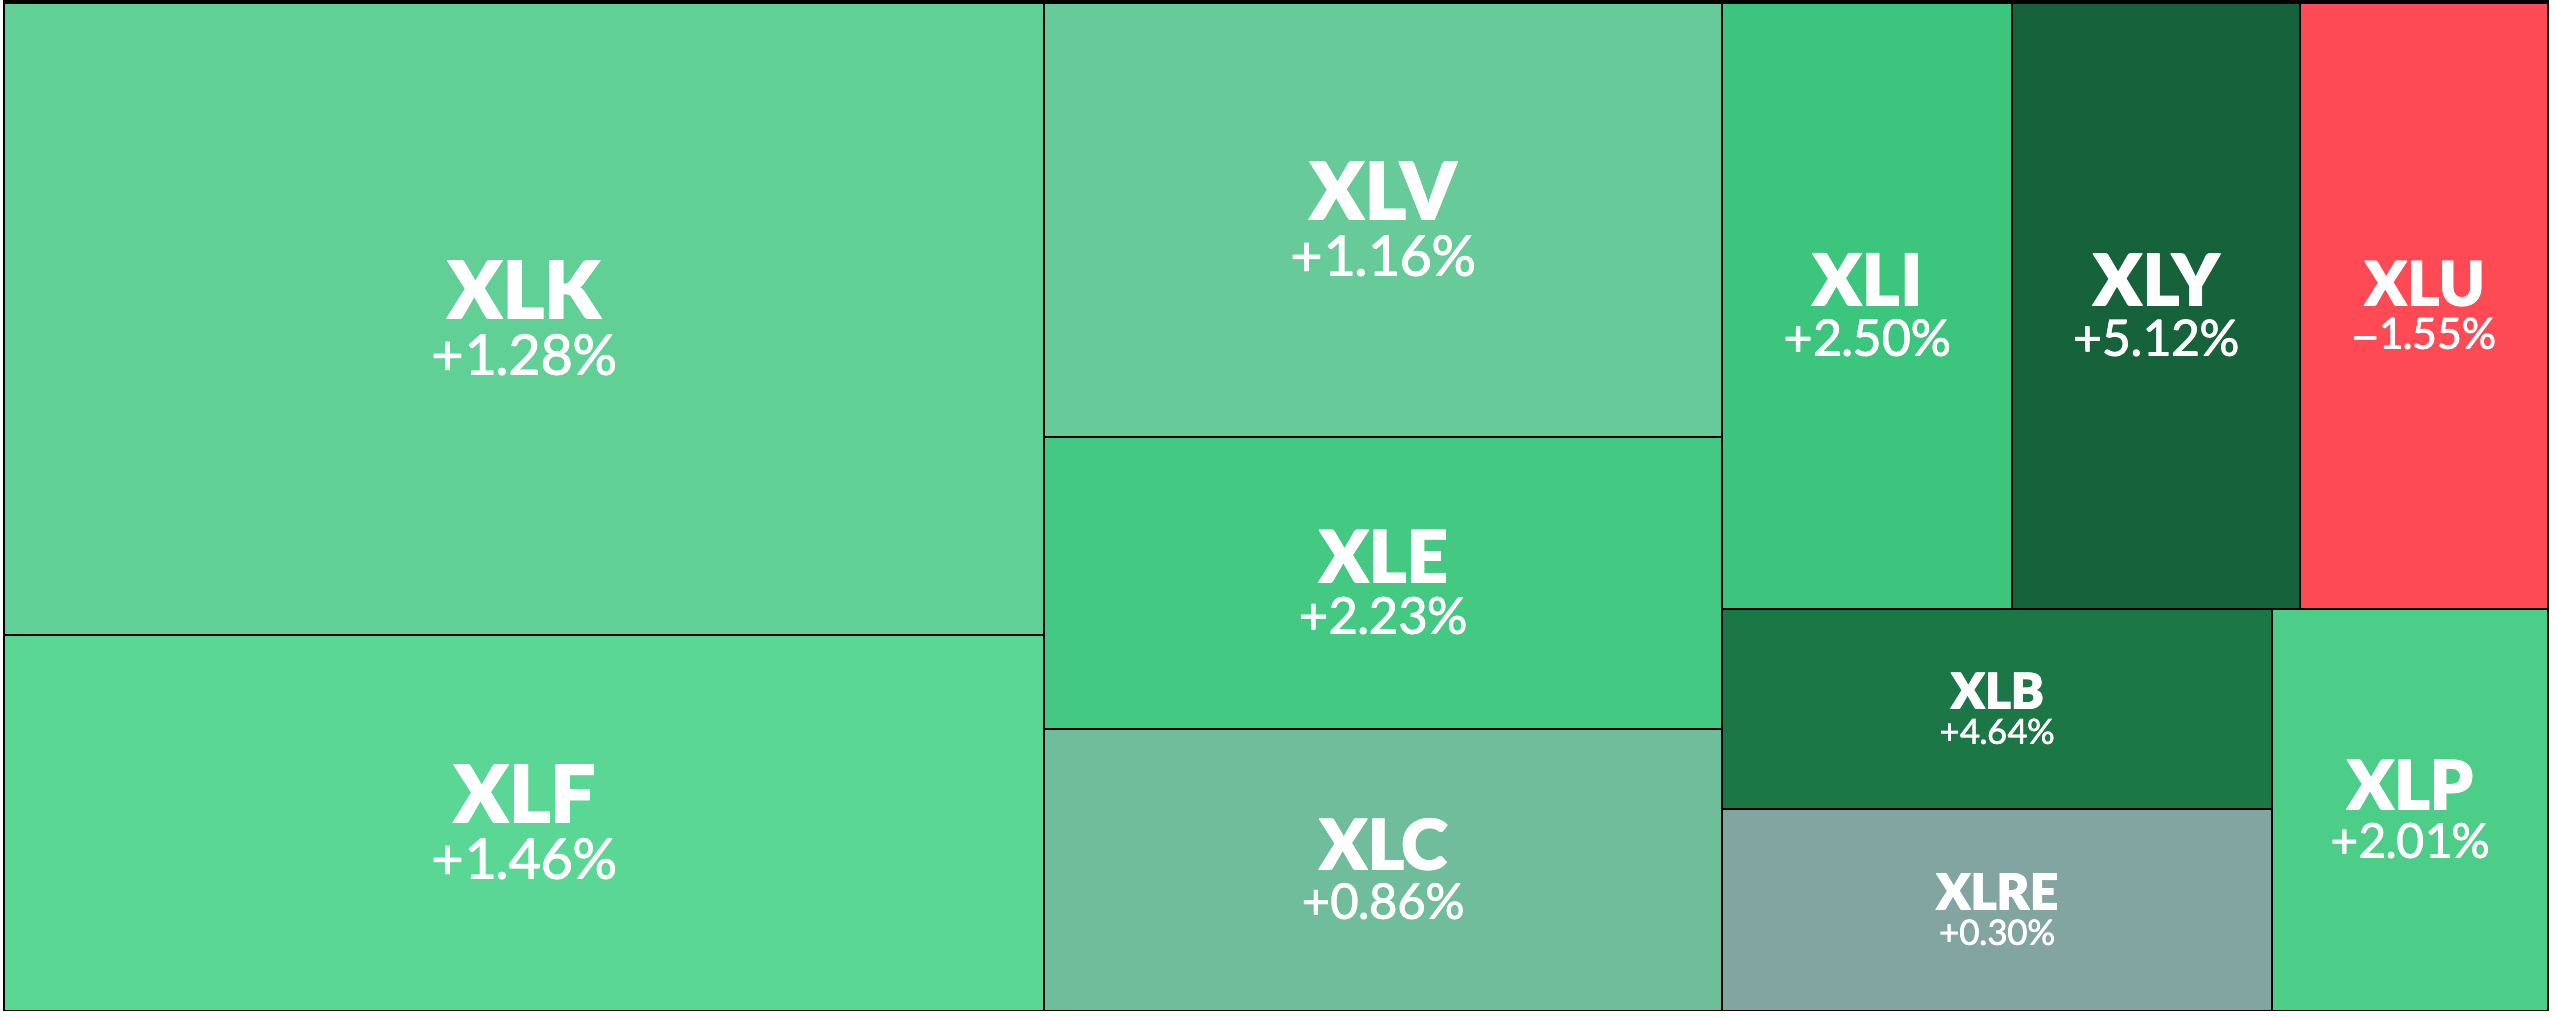
There are some notes about the main drivers that are worth studying:
1. Consumer Discretionary (XLY +5.12%) : Pure “Risk-On” sentiment. Being the clear leader indicates investors are betting on a resilient US consumer and economic growth rather than a recession. This sector is heavily weighted by Tesla and Amazon, so a rebound in those mega-caps typically forces this sector to outperform (AMZN rallied and TSLA is bouncing after reaching our bearish target).
2. Materials (XLB +4.64%): The “Reflation” Trade. A surge in materials often signals that the market expects global industrial demand to pick up.
3. Industrials (XLI +2.50%): Economic Confidence. Money flowing into Industrials suggests institutional rotation out of pure speculation and into “real economy” stocks (transportation, defense, manufacturing). It validates the rally we saw broadening beyond just Tech.
4. Energy (XLE +2.23%): Value Rotation & Geopolitics. Energy acted as a stabilizer. With oil prices holding firm, this sector attracted capital looking for undervalued cash flows and a hedge against potential geopolitical flare-ups.
5. Utilities (XLU -1.55%): This was the only sector in the red. Utilities are considered “bond proxies” (defensive dividend payers). When investors are confident (buying XLY) or when bond yields rise, they rotate out of safe havens like Utilities and vice-versa.
Looking ahead, the market faces a busy calendar with high-stakes policy and economic updates on the horizon. The Supreme Court did not issue a ruling on the legality of emergency tariffs this week, shifting investor focus to a potential decision next Wednesday. Market participants are also preparing for critical inflation data, with the December Consumer Price Index and Producer Price Index scheduled for release next week. These reports will provide essential clarity on the Federal Reserve’s policy path as Wall Street navigates the early weeks of the new trading year.
High Probability Setups
As we discussed on Wednesday, news events are often just catalysts for technical setups. For this reason, while we monitor the macro environment, my primary focus remains on Price Action. We track over 30 securities, including indices, ETFs, Megacaps, Metals, and Crypto, to anticipate market moves.
Most importantly, we curate the best opportunities into a High Probability Setups list for the week ahead. Each setup includes specific price targets (which are often exceeded) and invalidation levels, giving subscribers an objective reference to avoid bad trades and protect capital.
The SmartReversals Edge:
Precision: Every setup comes with exact Target Prices and Invalidation Levels.
Performance: A cumulated 78% win rate.
Rotation: Deep analysis of major assets like SPX, NDX, NVDA, TSLA, and many others listed below 3X a week. Beyond the majors, we actively highlight when other securities offer superior Risk/Reward ratios, empowering you to rotate capital efficiently.
These actionable insights provide the coordinates you need to make decisions, protect capital, and stay on the right side of the trend. Here is the outcome of our recent setups:
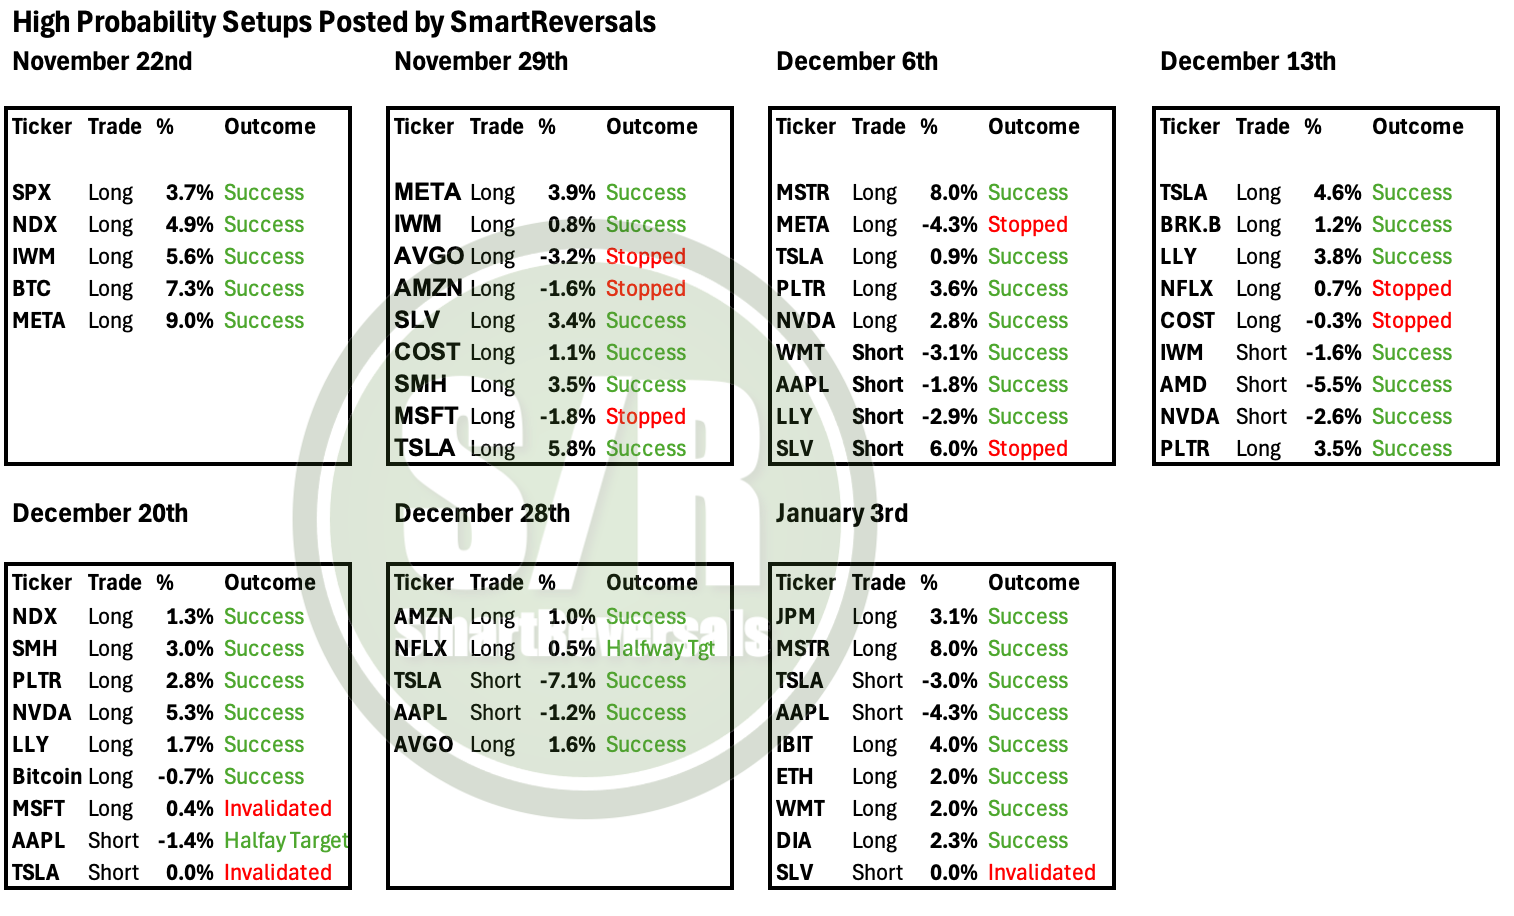
Unlock next week's High Probability Setups! The professional insights are worth far more than the price of the subscription.
When you upgrade your subscription, you also unlock my eBook on advanced technical indicators, which includes comprehensive sections on:
Volume Profile
Support/Resistance (S/R) Levels
Advanced Oscillators
Valuation Ratios
Confluence Analysis
Case Studies
The eBook is right here in this publication! 👇👇👇 below the High Probability Setups for next week.
Today’s Agenda
Momentum Map and SPX
High Probability Setups for Next Week
Major Indices, Volatility, Stock Participation, Bitcoin
Individual Stocks, Metals, and ETFs
Momentum Map and SPX
Crypto-related securities reached their bullish targets and reversed quickly, showing the extended choppiness of the multi-week consolidation we have been studying. All semiconductor securities have confirmed their weakening context, while stocks like COST and AMZN, which we had in our sights last week, finally broke out.
Remember that the quadrant must be assessed alongside individual technical analysis, and then that analysis must be sealed with specific price levels for confirmation. This structured sequence is the same one we saw months ago with AAPL and TSLA before rallying, and later with LLY and WMT, which are now in the Leading quadrant.
NVDA has fallen into Lagging; recall my note from last weekend anticipating a decline based on the shooting star candle. From a long-term view, it is interesting to see NVDA back in Lagging. Let’s see how to navigate the current momentum now that semiconductor securities are weakening, GOOG is the only ‘Magnificent 7’ stock in Leading, and non-tech sectors are improving: