
Strait of Hope Meets IPO Hype: How Strong Is the Bounce?
Optimism in the Strait and IPO euphoria drove the rebound, but any minimal break next week could send markets tumbling again.


U.S. equities closed a volatile week with broad gains. Falling oil prices followed geopolitical headlines, and the blockbuster SPCX IPO stabilized the tape after a -4% sharp selloff in the SPX and -6% in the NDX. The S&P 500 bounced and closed positive +0.65% for the week. the Nasdaq 100 (NDX) added 2.3%, and the Dow Jones climbed 0.7%. The week was not clean, the S&P 500 and the Dow swung wildly mid-week on optimism about the conflict with Iran. Small caps joined the late rally with the Russell 2000 advanced 4.0% during the week.
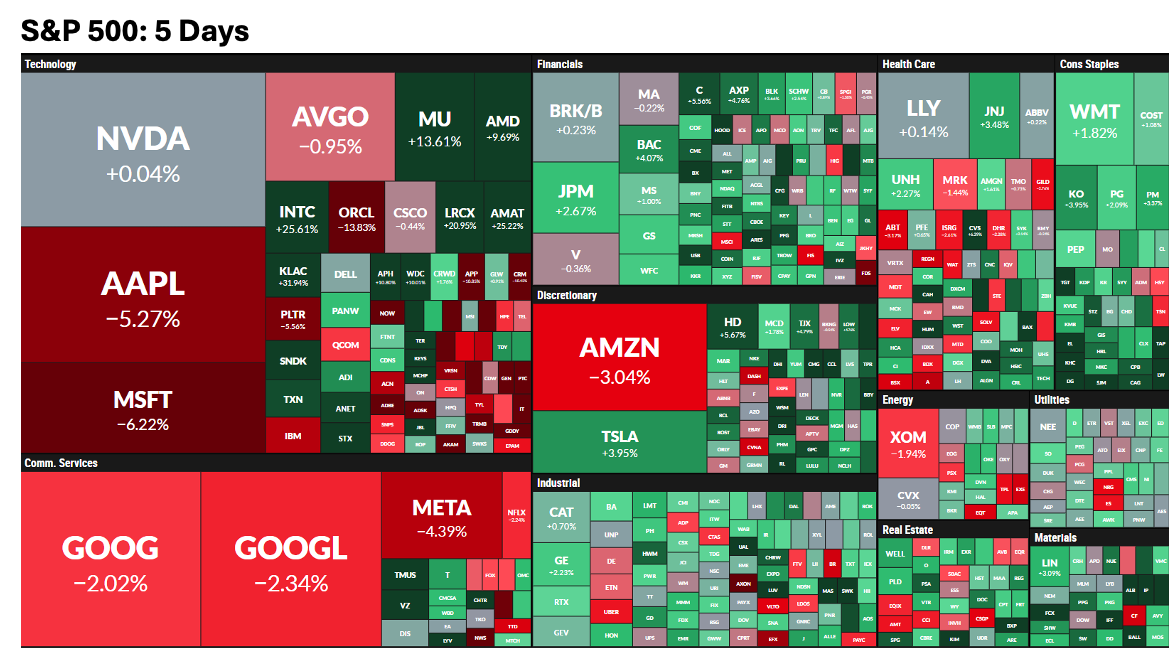
SpaceX (SPCX): The company sold 555.6 million shares at $135 each, a $1.77 trillion valuation. The stock opened at $150, an 11.0% premium, and held 20.0% above the offer price through its debut. The the soft action shows declines in other mega-cap tech names as investors sell what they own to fund what they want. See the weekly heat map below with the Magnificent Seven declining while the broad SPX was green. Only TSLA made it for a bounce and semiconductors held firm.
I wrote a special study about IPOs, the move just observed for SPCX is not new, unlock the study focused on technical moves, seems that SpaceX is moving like two of them already.

Macro: Consumer data improved at the margin. The preliminary June University of Michigan Consumer Sentiment index rose to 48.9 from 44.8 in May, helped by lower gasoline prices early in the month. Inflation concerns remain elevated. The setup into next week is constructive but earned session by session.
Setups Blueprint: AAPL, MSFT, SPX, AVGO, GLD declined as expected this week🎯, and VXX bounced as expected 🎯, all of them averaging a +5% gain 🎯🎯🎯. With that said, I reframed a standard industry momentum map to a proprietary Heat Rank where I set the technical conditions from overbought to oversold and the reversal risk for all the securities in our watchlist. It has been useful to set a blueprint where every subscriber see the stocks better classified and navigated the ones highlighted or subscribers’ preferred stocks. This applies for the following watchlist:
Indices & ETFs: SPX/SPY, NDX/QQQ, DJI/DIA, IWM, SMH, TLT, GLD, SLV, DIA, VXX, ETHA, IBIT
Major Stocks: AAPL, MSFT, GOOG, AMZN, NVDA, META, TSLA, BRK.B, LLY, WMT, AVGO, COST, JPM, XOM, PLTR, NFLX, V, AMD
If you invest or trade one or some of them, they are always analyzed in my publications including bullish/bearish conditions, specific price targets, and invalidation levels. Subscribe to the paid plan and unlock it.
Today’s Agenda
Market Context: Charts + levels for Indices, ETFs, Volatility, Breadth, and Crypto.
The Heat Rank: Analyzing the stage of every security in a single view.
Setups Blueprint: Entry levels for short and long setups with price targets and invalidation levels for all the securities in the watchlist prioritizing stronger setups.
Deep Dive: Individual analysis with charts and targets for Mag Seven and setups.
Let’s begin.
SPX: Initial Bearish Target Nailed - Elliot Wave Assessment for Continuation
Last Friday, I posted with the weekly S/R levels the most likely pullback destination using the Fibonacci retracement approach, with $7,311 as the confluence zone with our support levels. The thesis proved accurate, the current bounce could still be part of a pullback considering the recent lack of conviction. Let’s examine reversal zones from an Elliott Wave perspective, again combined with our S/R levels to increase reliability, the arrows in the chart highlight the likely destination zone for this move: