


U.S. stocks closed mixed today following a re-escalation in geopolitical tensions. Main market indexes experienced a highly volatile session, initially tumbling before trimming some losses. The Dow Jones fell-1.1%, probably an initial validation of the overheated signals studied for the previous week, the SPX closed slightly negative -0.3%, and the NDX closed +0.3% despite of the selloff in premarket this morning.
SMH Bounced +2%, How is it Possible?
Last night, I shared the SMH chart with subscribers, highlighting a bullish reversal candle at the lower band, an oversold Stochastic indicator, and the open gap above. As I noted, this “COULD trigger a bounce tomorrow”, which is what we saw today.
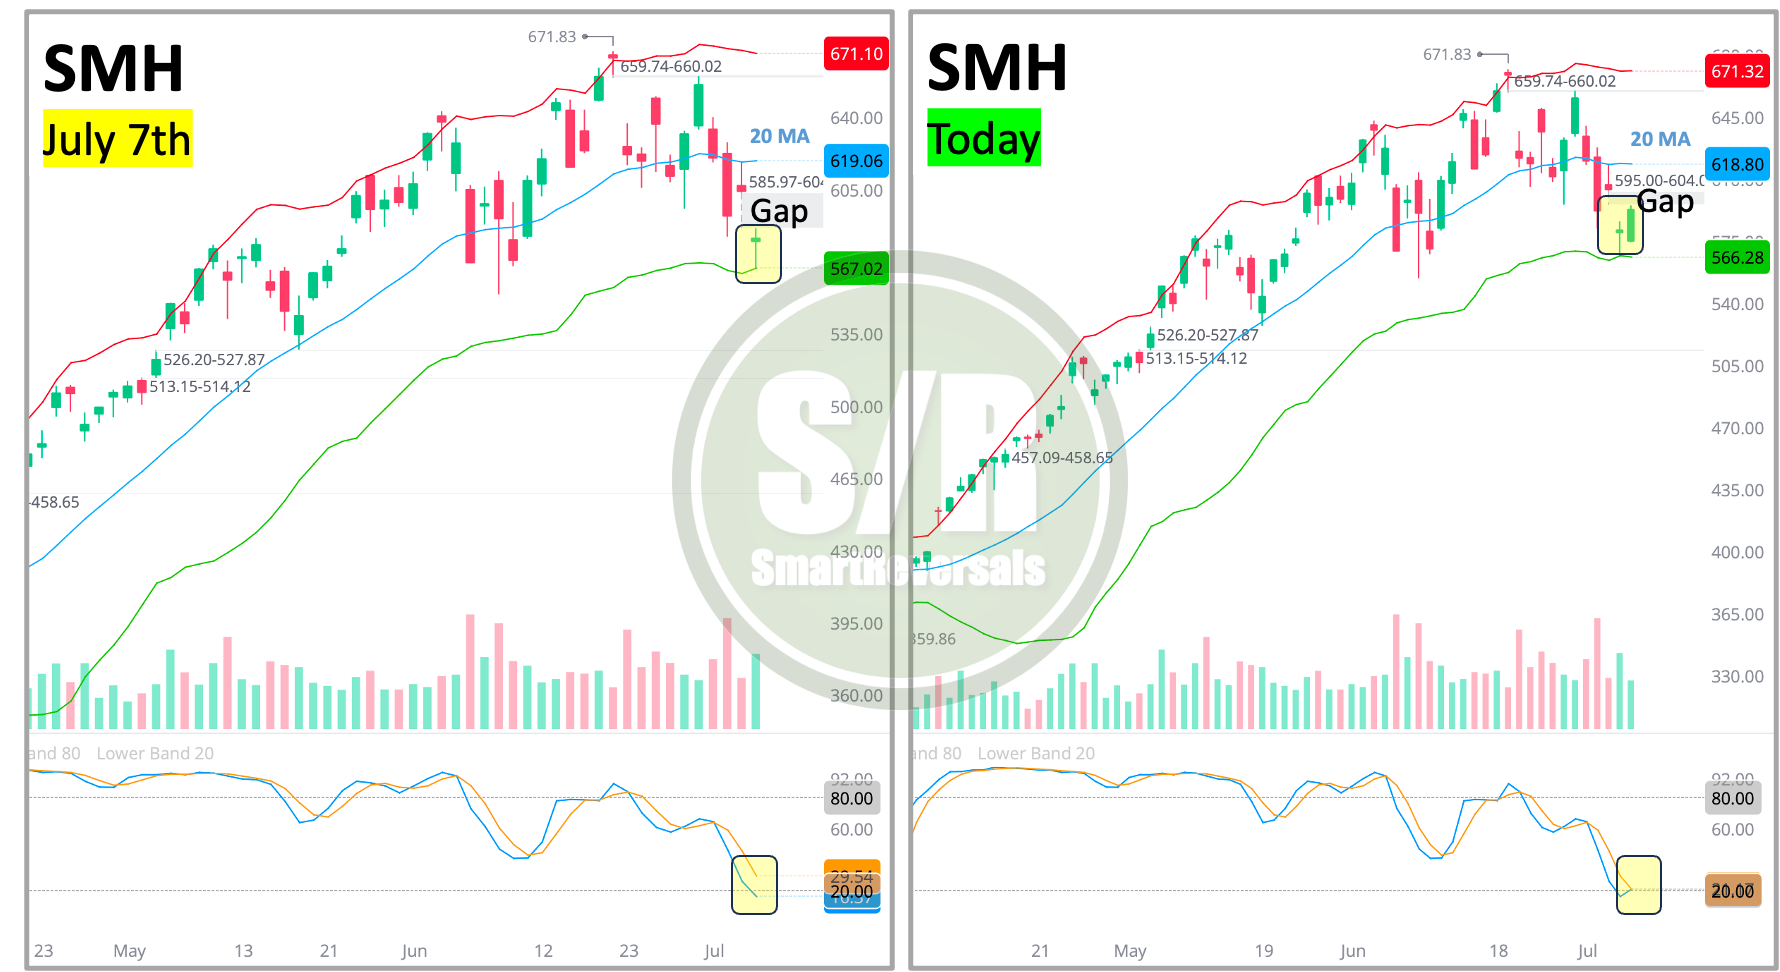
Was it a smooth bounce? Not at all. The morning selloff was strong, which is precisely why I provided modeled daily levels (bullish above / bearish below) for today. This included not only the standard SPX levels for paid subscribers in our daily edition, but also for QQQ, SMH, NVDA, AMD, MU, QCOM, TSM, and AMAT, allowing subscribers to validate every move using the central daily level (CDL) and the targets around it.
For example:
The Central Daily Level (CDL) for SMH was 578, with the price turning bullish above it and bearish below. At the open (9:32AM), the price recovered this level, triggering a bullish alert for long positions (and invalidating short positions). Furthermore, the index bounced to 589 and consolidated at 10:00 AM before reversing to revisit 578. It respected that level perfectly, subsequently rallying toward 589 and 597. These were all provided as modeled levels last night, where institutional algorithms often react, as we saw today.
Potential Bullish Setup + Central Level Recovered = Confirmation
Last night, I also highlighted NVDA’s bounce from its 200DMA and the importance of 195.5 as today’s CDL. Once the initial resistance at 199 was breached, the price moved to 202, the next modeled level, and closed the day in the green.
Similar accuracy was seen across MU, AVGO, QCOM, AMAT, TSM, and AMD, while the QQQ CDL at 710 served as resistance throughout the entire session.
Today, we will analyze charts for SPX, NDX, SMH, AAPL, NFLX, NVDA, and others, tracking also the high-probability setups posted on Saturday. As noted yesterday, the bearish target for SMH has essentially been reached, while the bullish targets for IBIT, ETHA, GLD had been reached as well.
Everything provided here is specific and transparent. I rely on technicals and specific-modeled levels, not gut feelings or macro projections that leave your capital at risk for months. Upgrade to the paid plan now.
Tomorrow’s SPX levels are available here. Note how 7,418 acted as precise support and 7476 as resistance today, both were analyzed last night. Levels for QQQ, SMH, NVDA, MU, AMD, AVGO, QCOM, TSM, and the rest of the semiconductor set are also linked below, providing you with objective targets for tomorrow’s session.
Let’s begin.
SPX: On the Edge to Trigger Bearish Momentum
We use daily levels to anticipate short-term moves, weekly levels to navigate price action, and monthly levels to gauge longer-term momentum.
The Central Monthly Level (CML) was touched again today, this is what the chart and levels say: