


Wall Street endured a volatile week as a deeper pullback in major technology stocks snapped recent winning streaks in the SPX. For that reason, we closely tracked the QQQ / NDX in our daily market analysis this week.
Semiconductors remain under pressure. This week alone, the market darlings continued to be punished: AMD lost -11%, MU -13%, AVGO -7%, and NVDA -4%. The semiconductor ETF SMH we tracked throughout the week, fell -9%.
China’s newly unveiled “Moonshot” AI model and valuation concerns added pressure to the weak conditions we identified in last Saturday’s Weekly Compass for the SMH, NVDA, AVGO, and AMD, especially considering their failure to hold essential price levels after reversing from overbought conditions I highlighted in this publication in June, when many people were euphoric and skeptic about the overbought conditions in semis.
Technicals are proving their worth alerting about overextensions in semiconductors, just as they did with GLD and SLV since March, with PLTR since November, and with NFLX since July 2025.
That said, the NDX dropped -4% this week, breaching a highly relevant level and printing a major crossover. July is not proving to be as bullish as macro analysts suggest based on statistics (biased when there is a bias in years selected). A few weeks ago, I shared in this publication that the winning streak for July is starkly different if you compare the last 20 years to the previous 20; the story is completely inverse. For that reason, I always recommend analyzing charts and remaining skeptical of statistical tables that do not reflect the price action story behind every year analyzed.
Friday is our day for mapping the support and resistance levels for the week ahead. Below, you will find the levels where institutional algorithms are most likely to react. Numbers always tell the truth, and the weekly lows for TSLA, AMD, NVDA, and GOOG to name a few, they matched these levels (376, 468, 197, and 345.5, respectively)… same for the highs of the week for AAPL, WMT, and XOM to name a few (337, 117, 149, respectively).
Weekly levels for the week ahead are updated below for the following:
Indices & Futures: SPX, NDX, DJI, IWM, ES=F, NQ=F
ETFs: SPY, QQQ, SMH, TLT, GLD, SLV, DIA, VXX
Major Stocks: AAPL, MSFT, GOOG, AMZN, NVDA, META, TSLA, BRK.B, LLY, WMT, AVGO, COST, JPM, XOM, PLTR, NFLX, V, AMD
Crypto & Related: Bitcoin, Ethereum, ETHA, IBIT
Leveraged ETFs: TQQQ, SQQQ, UDOW, SDOW, UPRO, SPXS, URTY, SRTY
These levels are modeled every Friday to help you assess bullish or bearish conditions and risk/reward before the market opens on Monday. You do not have to wait for the opening bell to decide your plan; you have the distances to essential levels and the setups indicating whether they will act as support or resistance well in advance, allowing you to make informed, serene decisions before Monday morning. Unlock these levels by upgrading to the paid plan:
When you subscribe you also receive daily updates for the SPX with daily levels.
Before continuing let’s remember my note last night about NFLX considering the selloff, paid subscribers knew the very high odds for a reversal at the opening, the stock bounced from -12% at the opening ($65, where weekly and monthly modeled levels matched) to -7% at the close (reaching the modeled weekly level of 69), that was an easy +5% scalp. The key levels to navigate NFLX next week are below. Be careful being bearish in this market without levels that can anticipate reversals.
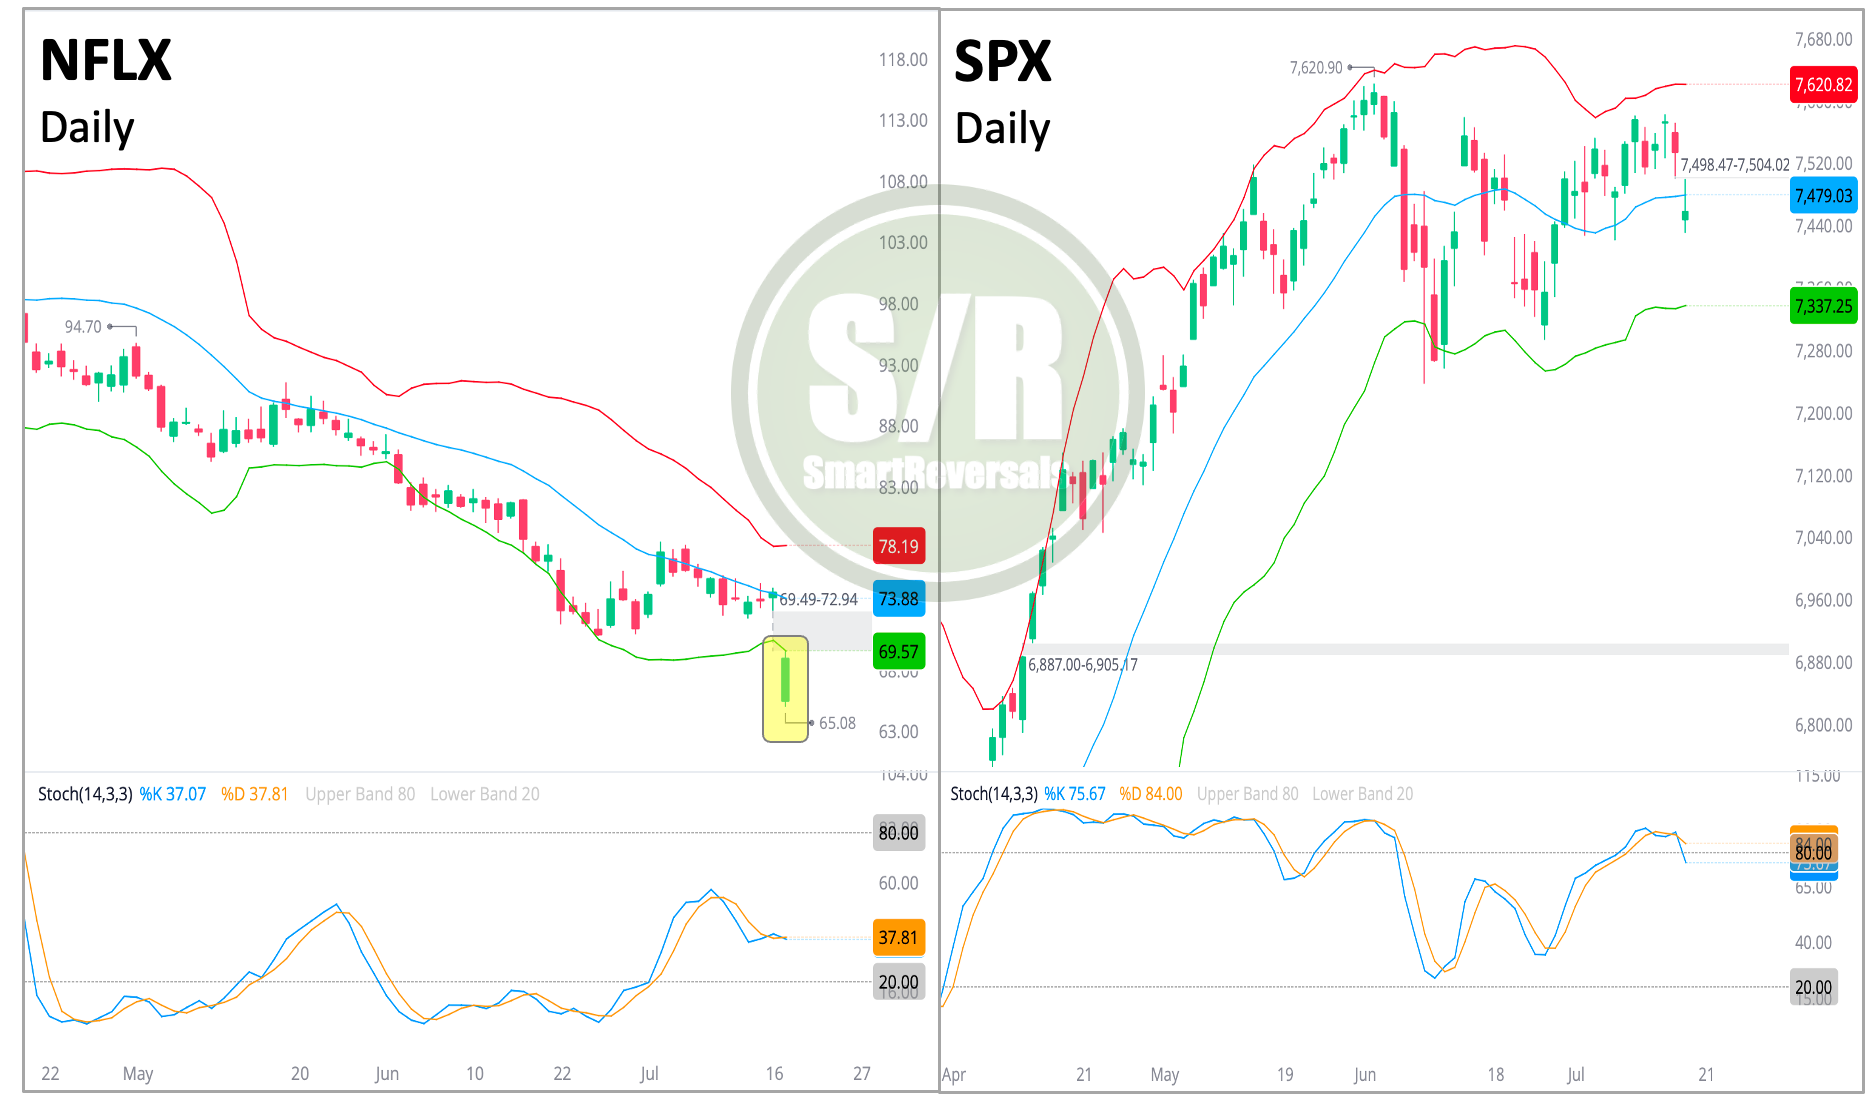
Regarding the SPX, the 20 daily moving average was breached and the oscillator is falling from overbought conditions, with a lot of space before getting oversold. Losing this moving average is usually concerning, the levels for the SPX and complete analysis is below. Plan ahead your trading week identifying the securities that are in bearish or bullish conditions and their distance to their targets + invalidation levels, get access now:
WEEKLY LEVELS
The SPX is in bear zone, the level to recover in order to flip momentum is not as close as in previous days, and the context for tech is more challenging.
There is always an opportunity, red marks are the securities struggling, green marks in the same column are the stocks in confort zone: