
Tech Came to the Rescue, Lead by Semiconductors
Next week is crucial; price action must confirm the sustainability of recent bounces in GOOG, AAPL, NVDA and TSLA. Key levels will be critical in determining the next move.

The market closed the week in the green, despite of a weakness in the SPX chart with a bearish RSI divergence, did the series of lower highs ended up becoming a bull flag?
Was that surprising? Not necessarily, last week I raised the importance of watching Semiconductors and NVDA, both with serious probabilities to continue bouncing, on the other hand the Volatility Index moved below the key level provided last Saturday.
Last Wednesday in the market update edition, the probability for a bounce in MSFT, TSLA, GOOG and AMZN was presented based on price action, oversold oscillators, and Bollinger bands, suggesting risk for short positions. Their bounce indeed helped the market to rally on Thursday.
But what was the most relevant factor? the excessive bearishness in the market, the American Association of Individual investors reported as of Wednesday, a 47% level of bearishness, which is extremely high versus an historical average of 31%.
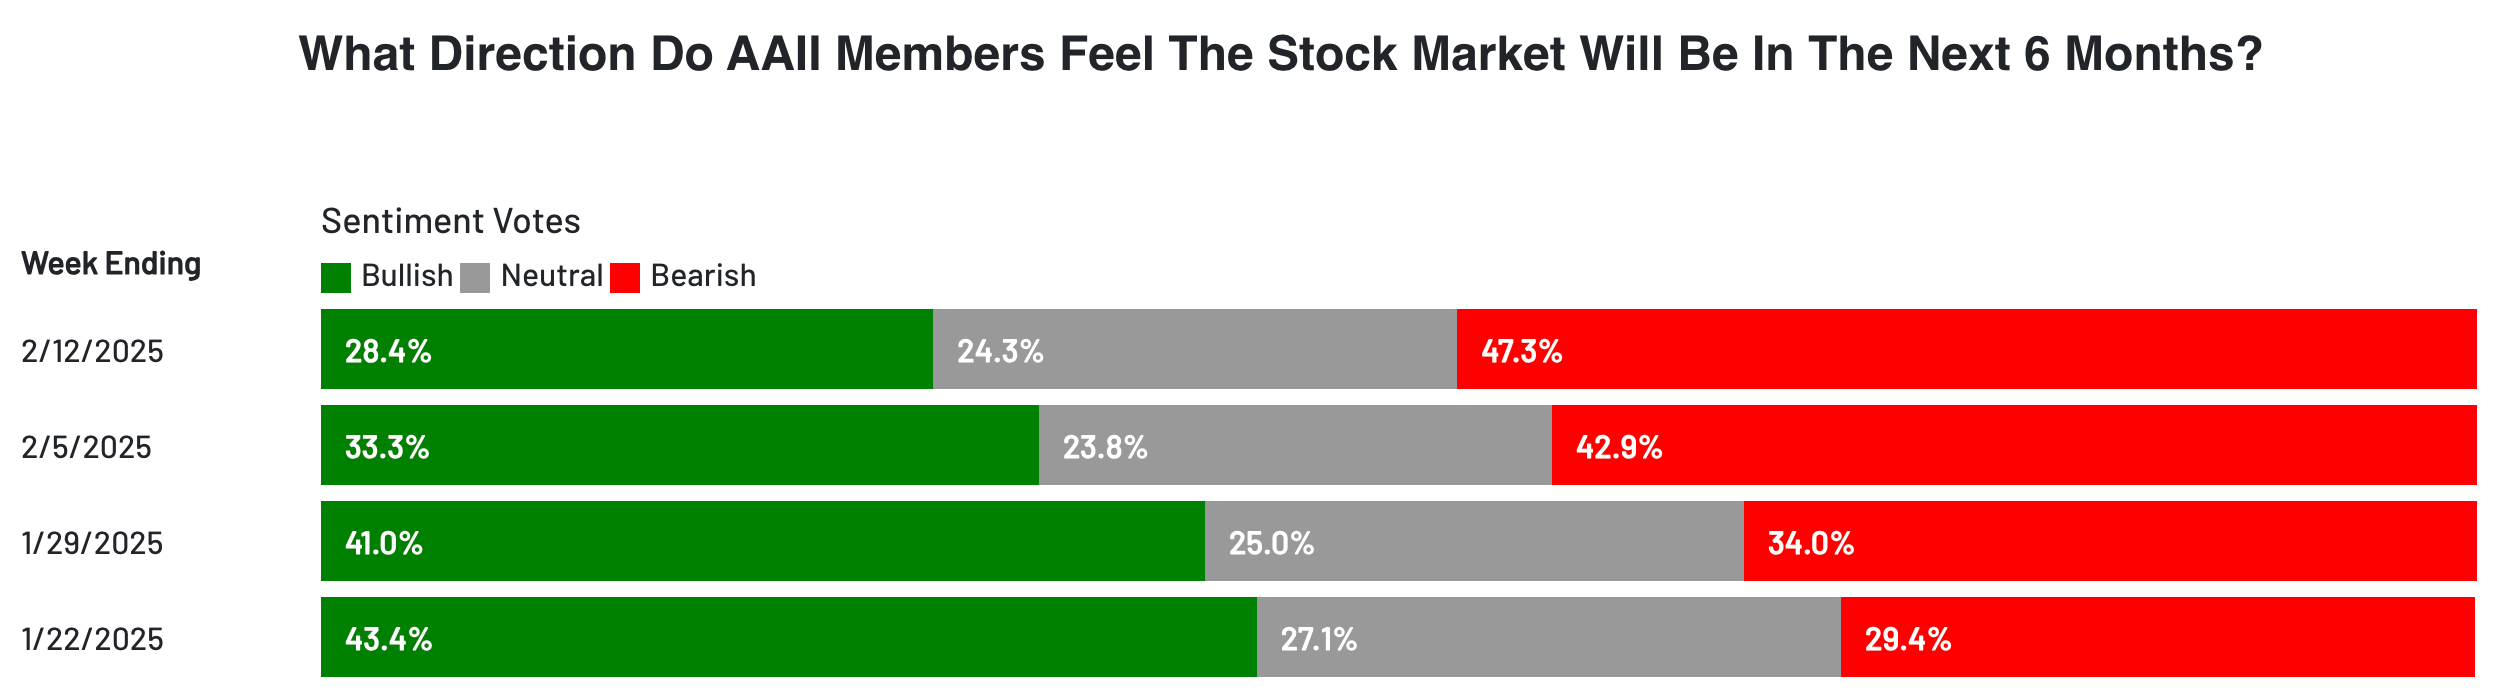
This extreme bearishness fueled the weekly bounce, even in the face of concerning CPI news. However, caution is warranted. The put/call ratio crossed 0.7 on Thursday, indicating substantial bearish sentiment, which often precedes strong bounces or rallies. Yet, the SPX closed flat on Friday with a doji candle at a bullish target (resistance) identified last week in this publication. Additionally, the Bullish Percent Index, highlighted in Wednesday's publication, continues its downtrend and did not participate in Thursday's bounce.
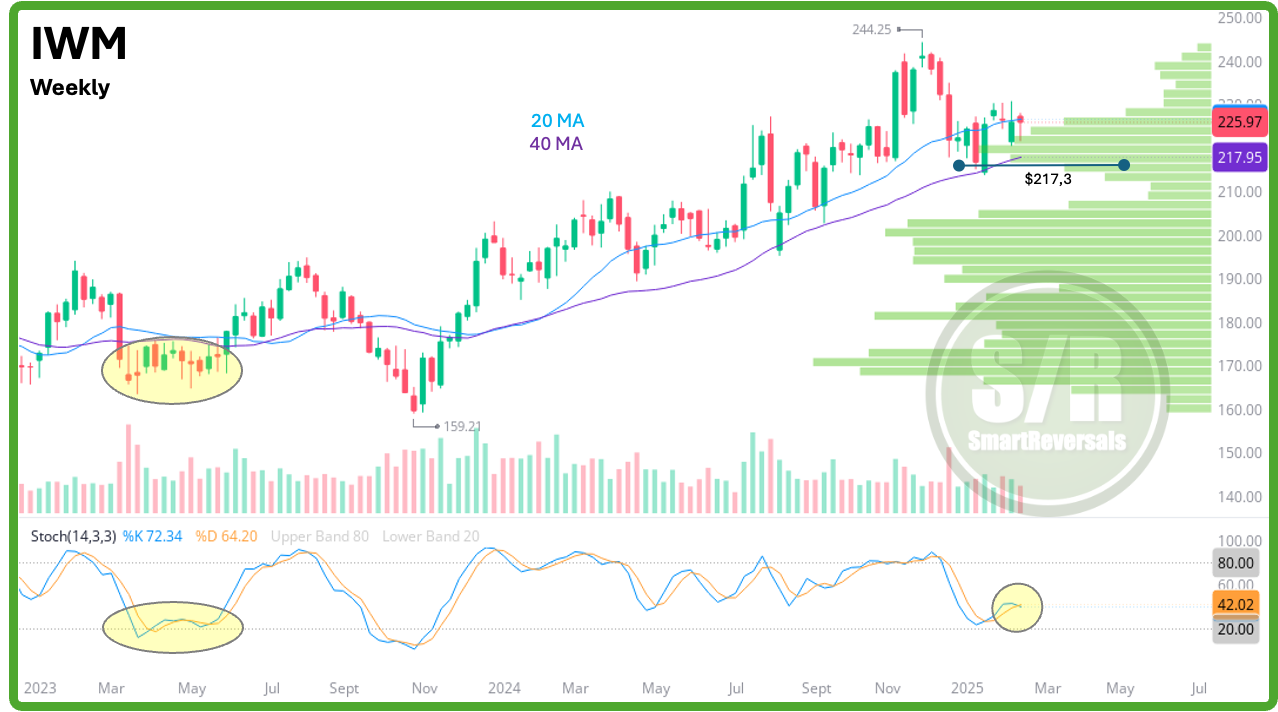
Small Caps (IWM)
Closing flat for the week, price action confirms the anticipated weakness in this security. The comparison with Q2 2023, discussed in recent updates, remains relevant. While historical chart patterns don't repeat exactly, technical principles do. The bearish stochastic crossover on the weekly chart, coupled with the weekly hanging man formation after two indecisive candles around the 20-week moving average, suggests further consolidation within the current volume shelf. On the daily timeframe, Friday's close was a red candle, intersecting with the 50-day moving average.
The setup is bearish, with strong support at $217.3. Looking ahead to next week, continued price action below $225.2 suggests further downside, with an immediate target of $222.5. Conversely, if price action recovers above $225.2 at the start of the week, the potential upside target is $228.7, where we anticipate significant resistance.
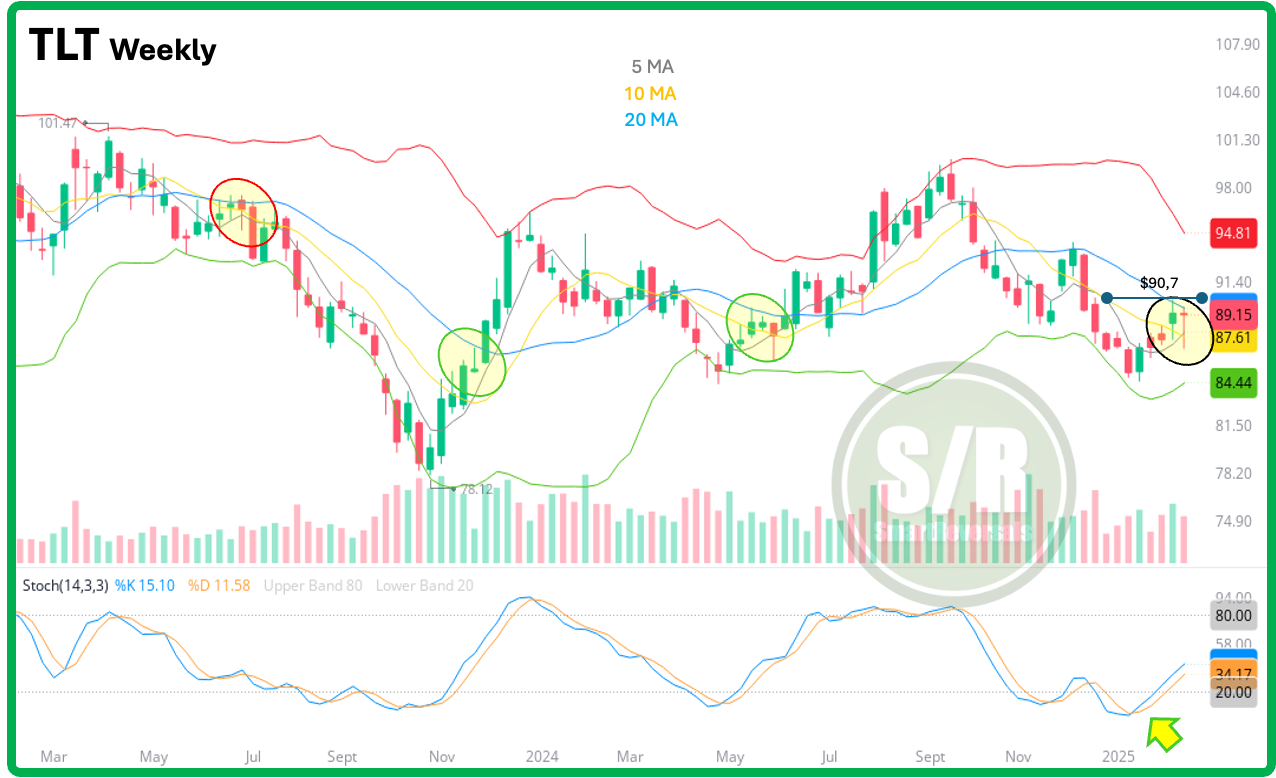
Bonds (TLT)
The anticipated volatility around the 20-week moving average persists. The confluence of this moving average with the annual resistance level of $90.7 presents a significant challenge for the 20-year Treasury bond ETF. Recent price action, including an indecisive weekly candle resembling a shooting star with a gap below, suggests a bearish resolution. This gap could attract further bearish momentum next week.
Should a bounce continuation occur, similar to previous instances (highlighted in green), the $88.6 level will be critical. A sustained move above this level would target $90.3. However, a break below $88.6, which appears likely, would target $87.4.
Gain access to in-depth analysis describing the current setups, with price targets and key annual support and resistance levels, for SPX, DXY, GLD, SLV, DJI, NDX, SMH, MSTR, PLTR, GOOG, AAPL, TSLA, NVDA, META, MSFT, AMZN, BTC, VIX, and breadth indicators. If you actively trade any of these securities, this publication is essential for making informed investment decisions. Subscribe now!
SPX - Why Recent Price Action Fails the Bull Flag Test