

Geopolitical events present a unique pricing challenge for financial markets. Unlike earnings reports or Federal Reserve decisions that arrive on a known schedule, geopolitical shocks are by nature unpredictable, rare, and of uncertain duration. This combination of characteristics creates a specific market dynamic: sharp initial reaction driven by uncertainty, followed by rapid reassessment as facts emerge.
There are three primary channels through which geopolitical shocks affect asset prices: 1) disruption to cross-border trade and investment, 2) contagion through financial linkages, and 3) elevated macroeconomic uncertainty. Of these three, uncertainty has the longest-lasting effect because it cannot be resolved until the event either escalates or de-escalates.
Markets do not price the event itself. They price the probability that the event will permanently alter real economic conditions. Most geopolitical events do not meet that threshold, which is why the recovery pattern is consistent.
The 1973 Yom Kippur War and the Oil Embargo that followed represent the most instructive case for worst case scenarios. The two events together, which occurred within 10 days of each other, produced a 43.2% S&P 500 decline over the following 12 months. This was not simply a geopolitical shock but a structural economic event: oil prices quadrupled, the U.S. entered a deep recession, and the inflation that followed shaped Federal Reserve policy for an entire decade.
On the other side, the October 7, 2023 Hamas attack is the most recently completed data point and one of the most instructive. Despite extreme initial uncertainty, the S&P 500 returned 33.5% over the following 12 months. The event did not disrupt global oil supply, did not spread to major economies in a way that affected trade, and did not alter the Federal Reserve’s rate trajectory. All three variables came up negative. The market followed the historical pattern.
The Cuban Missile Crisis of October 1962 is the most striking example of this dynamic. The world came as close to nuclear war as it has in the modern era, yet the S&P 500 gained 5.1% in the following month and 27.6% over 12 months.
Markets priced the resolution, not the peak fear.
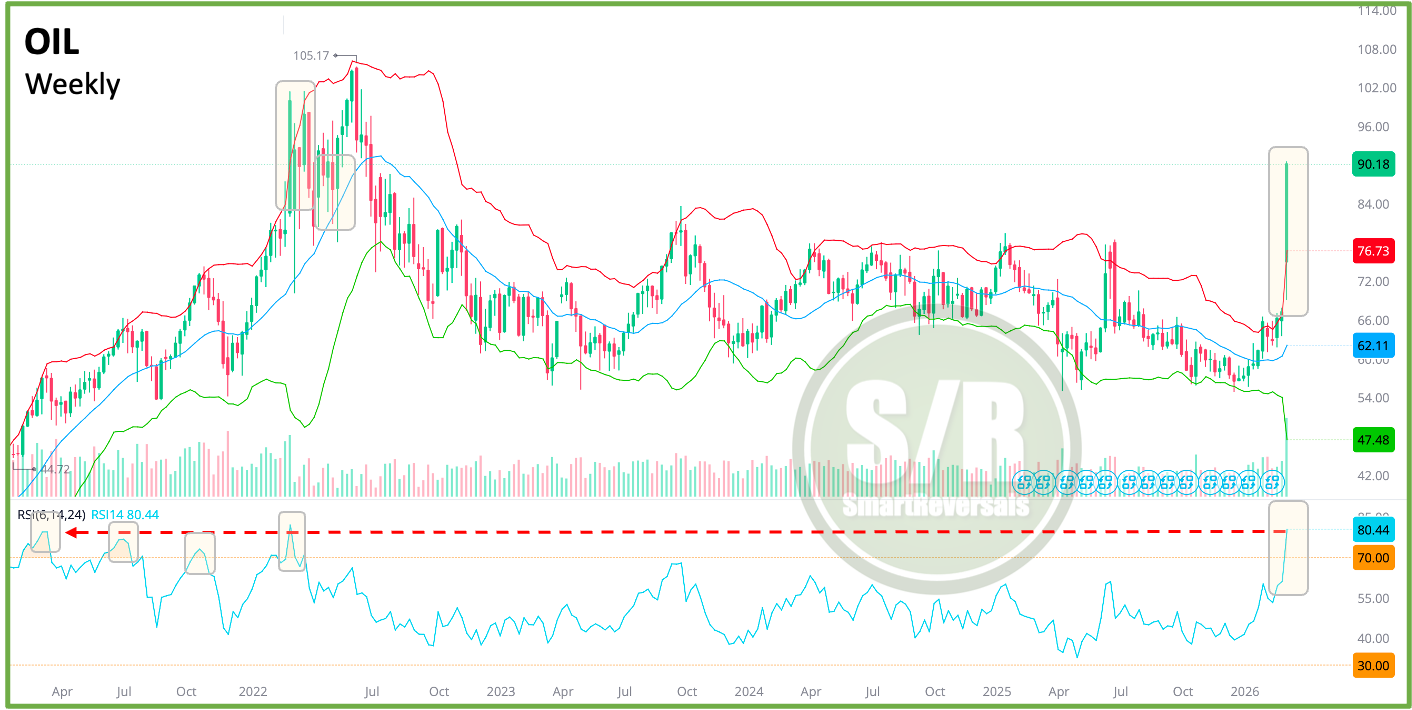
That said, oil is a key element to watch today, oil price shocks lasting fewer than 90 days tend to produce recoverable market impacts. Shocks persisting beyond one quarter begin altering corporate earnings forecasts, inflation expectations, and monetary policy, which is when short-term dips become multi-year bear markets.
Technicals apply to all asset classes, and Oil is currently overbought. In comparison to 2022, which also followed a major geopolitical event, those overbought conditions dissipated after two months. Today, Oil is more overbought than it was in 2022; consequently, a consolidation is likely, accompanied by extreme volatility that could also shake the stock market.
Volatility and High Probability Setups
From the setups posted last Saturday in this publication, the following happened:
🎯AAPL reached its extended bearish target of 254 for a -3.7% move
🎯SMH reached its extended bearish target of $386 for a -5% move
🎯GLD reached its bullish target of $497.8 for a +2.9% move.
🎯IWM reached its bearish target of $253.8 for a -3% move
🎯V reached its bullish target of $326.1 for a +1.9% move
🎯PLTR exceeded its extended target of $145 for more than a +6.1% move
✅QQQ reached its bearish target of $598.7 for a -1.4% move with choppy action
✅NFLX was bullish, and as anticipated last Saturday, its target is multi-week
❌LLY was the only setup invalidated that moved in the opposite direction.
🏅🏅🏅PLTR, SMH, and IWM actually extended the moves to the third bearish level, so the gains were even bigger.
That’s a 8/9 accuracy rate for a very volatile week. This is achievable using disciplined technical analysis and modeled support and resistance levels.
Subscribe and unlock this institutional grade approach every week. Our core watchlist includes megacaps and securities with high daily volume:
Indices & Futures: SPX, NDX, DJI, IWM, ES=F, NQ=F
ETFs: SPY, QQQ, SMH, TLT, GLD, SLV, DIA, SH, PSQ
Major Stocks: AAPL, MSFT, GOOG, AMZN, NVDA, META, TSLA, BRK.B, LLY, WMT, AVGO, COST, JPM, XOM, PLTR, NFLX, V, AMD
Crypto & Related: Bitcoin, Ethereum, ETHA, IBIT
Leveraged ETFs: TQQQ, SQQQ, UDOW, SDOW, UPRO, SPXS, URTY, SRTY
Today’s Agenda
The Momentum Map: Analyzing the stage of every security in a single chart.
Setups Blueprint: Entry levels for short and long setups with price targets and invalidation levels for all the securities in the watchlist prioritizing stronger setups.
Market Context: Technical charts and price levels for U.S. Indices, Volatility, Breadth, and Crypto.
Deep Dive: Individual analysis of Metals and Mega Caps (20+ charts).
Let’s continue, upgrade your subscription to the paid plan, and unlock the Take advantage of the market turmoil