
The Fire & Ice Rally
How Rate Cuts Fuel an Overheated Market, and Why a Pullback Is Part of the Journey to new Highs


The stock market is currently presenting investors with a fascinating contradiction, two competing narratives in opposite directions. The first, rooted in historical market cycles, suggests the S&P 500 and the NASDAQ may be approaching a correction. The second, driven by Federal Reserve policy shifts, indicates potential upside as interest rate cuts take effect. The economy's trajectory will ultimately determine which story unfolds.
The Bear Case: Market history has a tendency to echo through time, and the annual patterns, presidential election cycles, and seasonality suggest that after the current strong performance, volatility may emerge soon. We studied that possibility last Wednesday, and concluded what is very likely to happen after the delayed pullback. The publication based on historical technical patterns and price target for the SPX is here:

Today’s edition brings the next target for the indices based on the same methodology I used to anticipate in December 2024 a visit to $4,800 in the S&P500, and the same I used in May 2025 to forecast $6,486 for the index.
The Bull Case: The recent bullish overextension has been centered on the Federal Reserve's monetary policy stance. Lower interest rates typically act as a catalyst for both economic growth and stock market appreciation, and so far no “sell the news” has been seen.
The Critical Variable - Economic Trajectory: The resolution of this market puzzle hinges on a single crucial factor: whether the Federal Reserve can engineer a taming inflation while preserving economic growth boosting the jobs market. Should the Fed succeed, historical precedent strongly favors continued market strength. However, if rate cuts prove insufficient to address underlying economic weaknesses, investors may face significant headwinds.
This dynamic represents a classic tension between cyclical market forces and monetary policy influence—a complex but historically familiar market environment that will test both the Fed's capabilities and investors' resolve.
As we always do, our focus remains on price action to navigate the market, not on news or economist forecasts. If we did otherwise, I wouldn't have documented bullish setups since April 2025 anticipating the current rally or bearish ones since January 2025 anticipating the crash!
Subscribe to the paid plan to unlock the technical setups for a constant universe of securities that provide bullish and bearish setups so you have different alternatives to make decisions for long and short positions.
Remember that on Wednesdays, we post our Market Intelligence studies or fundamental analysis for the companies we cover:
These publications can also include new investment ideas. Following our September 10th publication, the gains for the companies brought have been:
APP: +14.5%
DASH: +3.1%
HOOD: +6.2%
ADBE: +4.5%
SPX since the Publication: +2%
The publication can be read here, it included fundamentals, technicals, and Support and Resistance Levels for the investment ideas, for the publication click here:
Unlock all the content with the premium subscription, a new set of trade ideas based on fundamentals and technicals is coming this Wednesday.
This publication brings the targets for the end of the year for the indices. As usual, the securities analyzed are: SPX, VIX, NDX, DJIA, IWM, SMH, SLV, GLD, WMT, BRK.B, NFLX, PLTR, GOOG, AAPL, TSLA, NVDA, META, MSFT, AMZN, and Bitcoin, along with our breadth analysis. If you invest in one or some of them, this publication is for you.
I know many of you track the SPY and the QQQ, so their levels are included today. The paid section unlocks the figures blurred in the chart below, including the next annual level to watch, oscillators, the strongest current support, the central level that differentiates bullish momentum from bearish for next week, and the immediate price targets.
The five indicators to watch for next week are also updated below, they protected us to make premature decisions and kept us riding the rally.
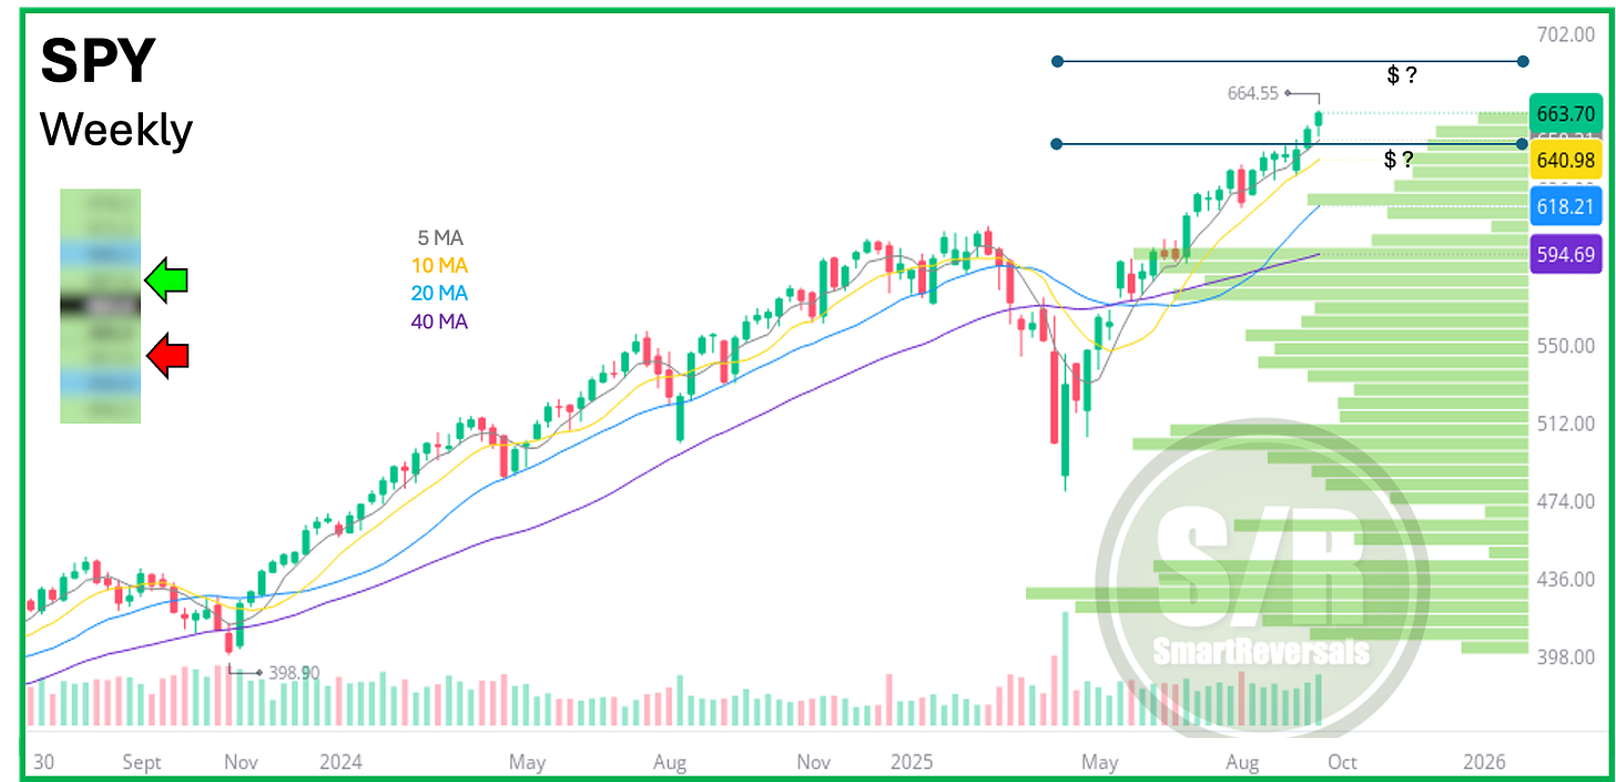
Let’s begin with historical references of rate cuts at similar stages of the stock market cycle, and we continue with the SPY targets, then the SPX and the usual technical immersions:
SPY and SPX: Balancing Rate Cuts with the Current Overextension