
The Market Overextension Continues, Tech Rally Offset by Overbought Risks?
Monthly and Weekly charts showing key elements to consider continuation or pullback for SPX, QQQ, IWM, TSLA, AAPL, NVDA, All Mag 7, DAX, NIFTY, BTC, GDX, DJI, OIL, and Breadth Indicators.


In addition to the previous weekly newsletter, a special study featuring 7 charts compared various historical instances of overextension was published last weekend, a "trifecta" of indicators that historically preceded market declines were identified. Interestingly, one factor remained non-bearish last week, contributing to the continuation rally that closed out March.
While price action signaled weekly bullishness, a short-term warning presented to subscribers emerged from market breadth, leading to a four-day decline. However, the market found support at the 10-day moving average (10DMA) instead of revisiting the usual 20DMA, resulting in a bounce and a green weekly closing candle. Even better, market breadth improved.
Since March ended this week, this weekend edition features both Monthly and Weekly candles. This provides two valuable perspectives on current market conditions. Enjoy!
SP500:
Monthly Chart:
There is a divergence between price and oscillators. A new bullish candle emerged during a historically weak season, while the Stochastic indicator warns of a potential bearish crossover.
The Monthly RSI is approaching 70, a level requiring caution and close attention to reversal signals. Interestingly, the current level of overbought RSI is not as extreme as it was in 2021. This doesn't guarantee the same level of overbought conditions will occur, but it offers a perspective on the current price action.
The monthly chart also highlights the importance of the 50-day Moving Average (the purple line). This line acted as support during the COVID crash and the 2022 bear market. Keep an eye on it for future corrections and potential bear markets.
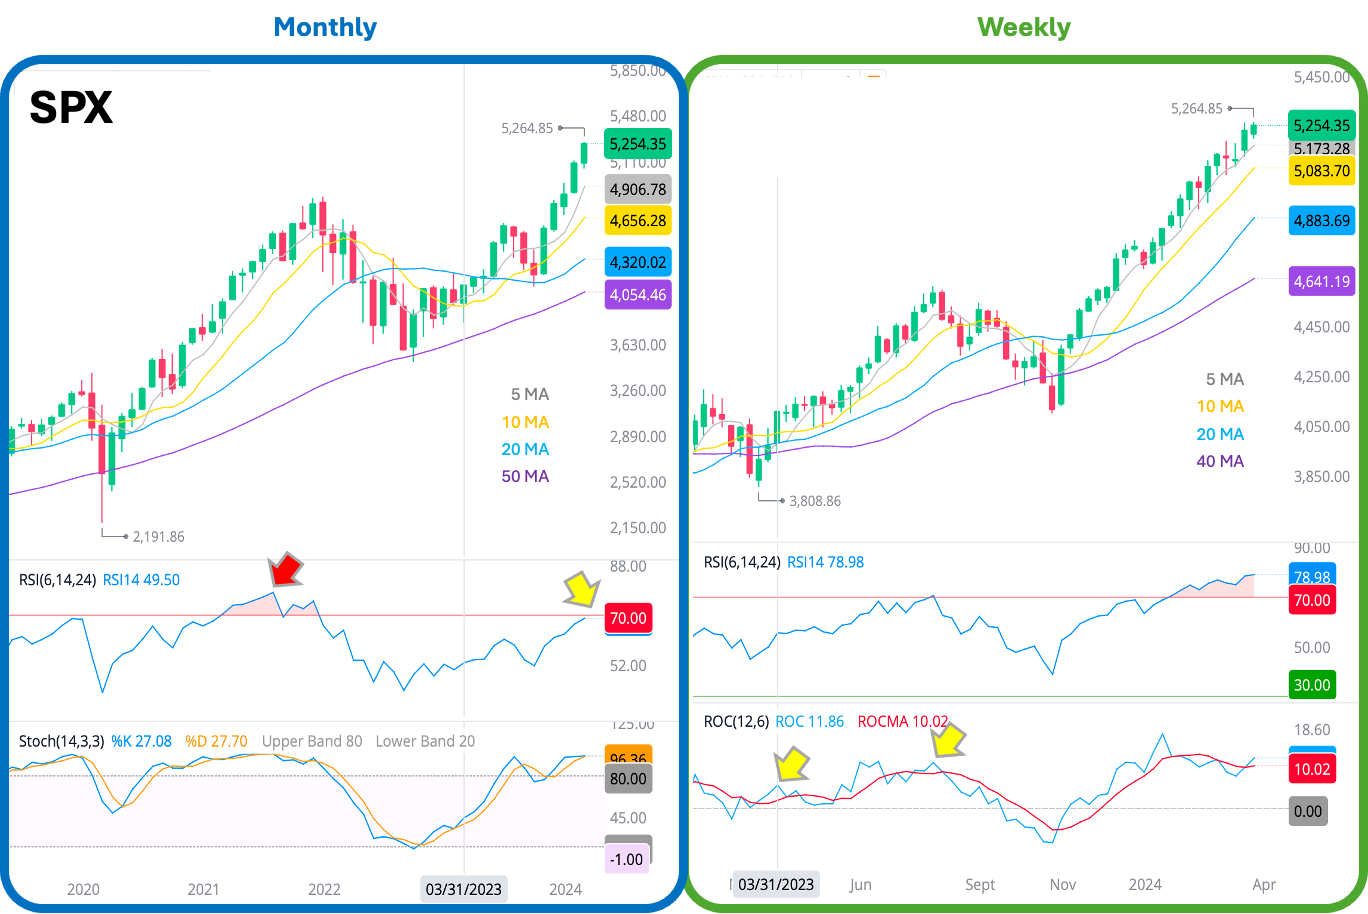
Weekly Chart:
The ROC indicator shows a temporary invalidation. However, this indicator is not smoothed like Bollinger Bands or moving averages, so it's important to monitor it closely. Quick invalidations have been seen during previous declines or consolidations.
This is the 10th consecutive week that the closing RSI has been above 70. This is significant and, as explored in last week's special analysis it could continue. Link below:
$5450 is the next strong Support/Resistance (S/R) level for the year. Based on the current chart, as long as the price action doesn't form a weekly reversal candle, a significant decline wouldn't be expected before that level based on the current technical picture.
$5110 has strengthened as S/R level, price has moved up 3% above that level, that can be a support for any pullback.

Market conditions:
VIX: The 20MA is still in support mode on the weekly chart, remember the educational content published before this one, when the Bollinger Bands squeeze, there a big move can be expected, that preceded the correction of August - October 2023. Squeezes don’t have rules in terms of time, for now 14.5 is a level to consider a breakout for VIX and a subsequent decline in the market.
TNX: See the purple line, the 40 Weekly Moving average has carried price since 2023, it’s difficult to expect a decline in the 10 year note before the oscillator reaches overbought conditions. 40.4 - 41.4 is a support zone that has to be broken to consider a rupture in the 40 Weekly Moving Average trend.