The Market's Hidden Blueprint: Annual Support & Resistance Levels
Market Overview & Fundamental Insights on GOOG and AMD


Support and resistance levels have consistently proven invaluable for navigating market fluctuations. Every Friday, these key levels are provided for weekly and monthly timeframes, and consistently, price action respects these boundaries. This week was no exception.
This edition brings a market update for several securities studied in the Weekly Compass using the S/R shared last Friday, then it continues with Fundamental Updates for GOOG, AMD and PLTR, to finalize with the first installment of annual S/R levels for (SPX NDX IWM SPY QQQ AMD PLTR and GOOG).
Last Monday the fundamental update for NFLX, META, AAPL, and MSFT was published for everyone, get access here. TSLA also included.
Let’s begin.
MARKET UPDATE
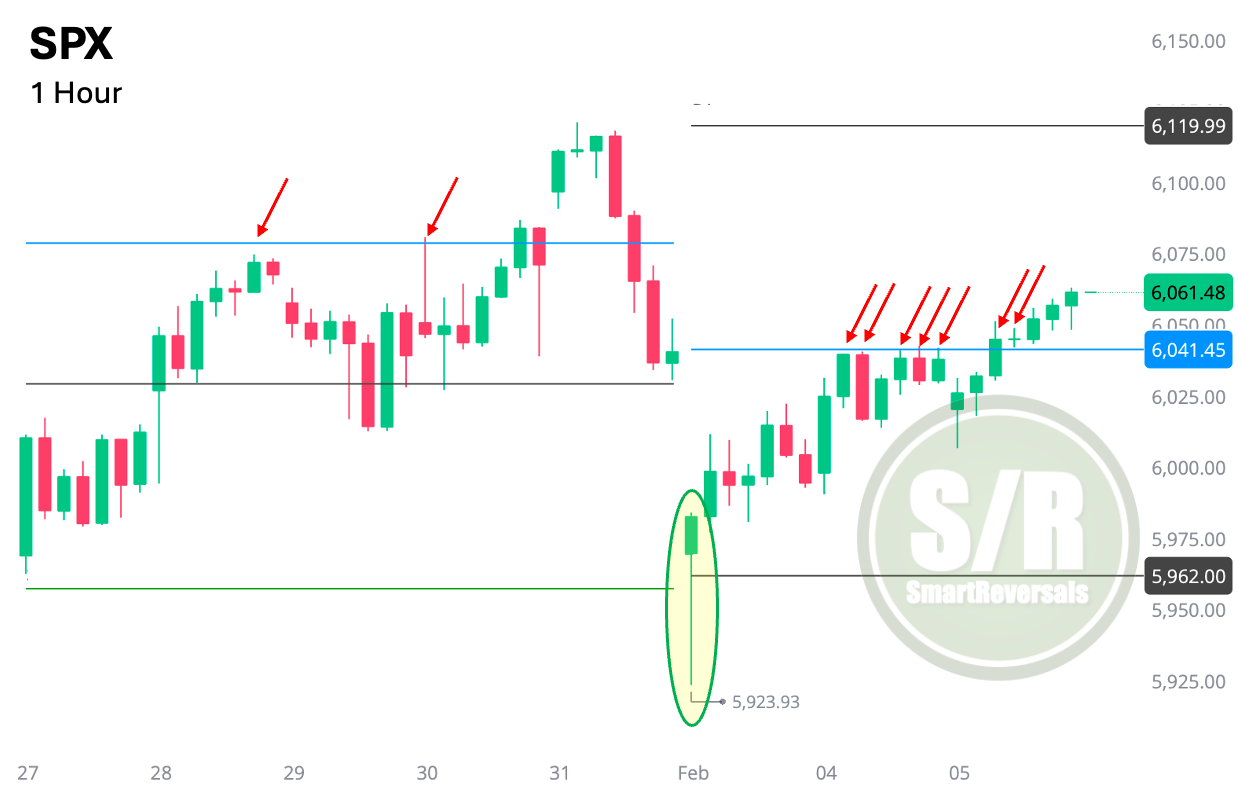
The S&P 500 (SPX) found solid support at $5962, as projected, before rebounding to $6041, where it encountered resistance yesterday and today price action finally crossed that line. This interaction with pre-defined levels underscores their predictive power for price consolidations or reversals.
Right now, price is aiming at $6119, a level that could be considered only if AMZN beats expectations, that is still yet to confirm, for now managing risk slightly below $6041 is prudent for longs. IF that blue line is lost like it happened last week, a revisit to $5962 would be very likely and the weekly setup would consolidate a bearish picture. Right now things are improving, but bear in mind the net move for SPX as of now is just +0.35% during the week.
While my personal analysis utilizes 2-hour and 4-hour charts, the strength of this bounce is readily apparent even on a 1-hour timeframe, further validating the significance of this level:
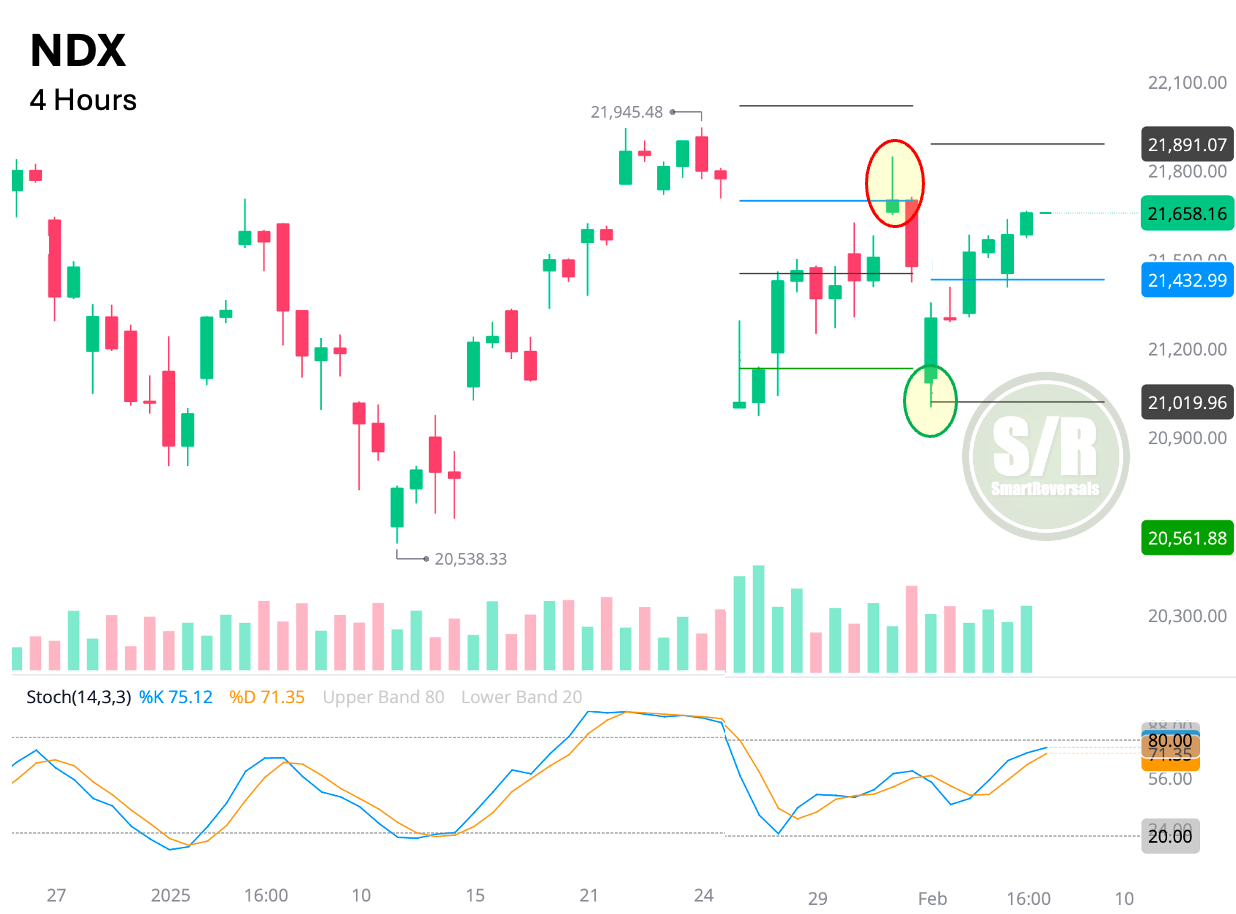
Similarly, the Nasdaq 100 (NDX) reached its bearish target zone of $21,019 on Monday, where the price found a floor and initiated a bounce. Right now the central level has been recovered and price action shows conviction for a green Thursday. Be mindful of green reversal candles, since that happened on December 26th after a setup that looked bullish. Managing risk using $21,432 as a reference is prudent, and similar to SPX, if that level is lost, $21,019 is the minimal bearish destination. All eyes on AMZN.
MSTR is red after hours, losing $338 and suggesting continuation to $319; be aware of $338 and $343 as bullish validators for any potential reversal.
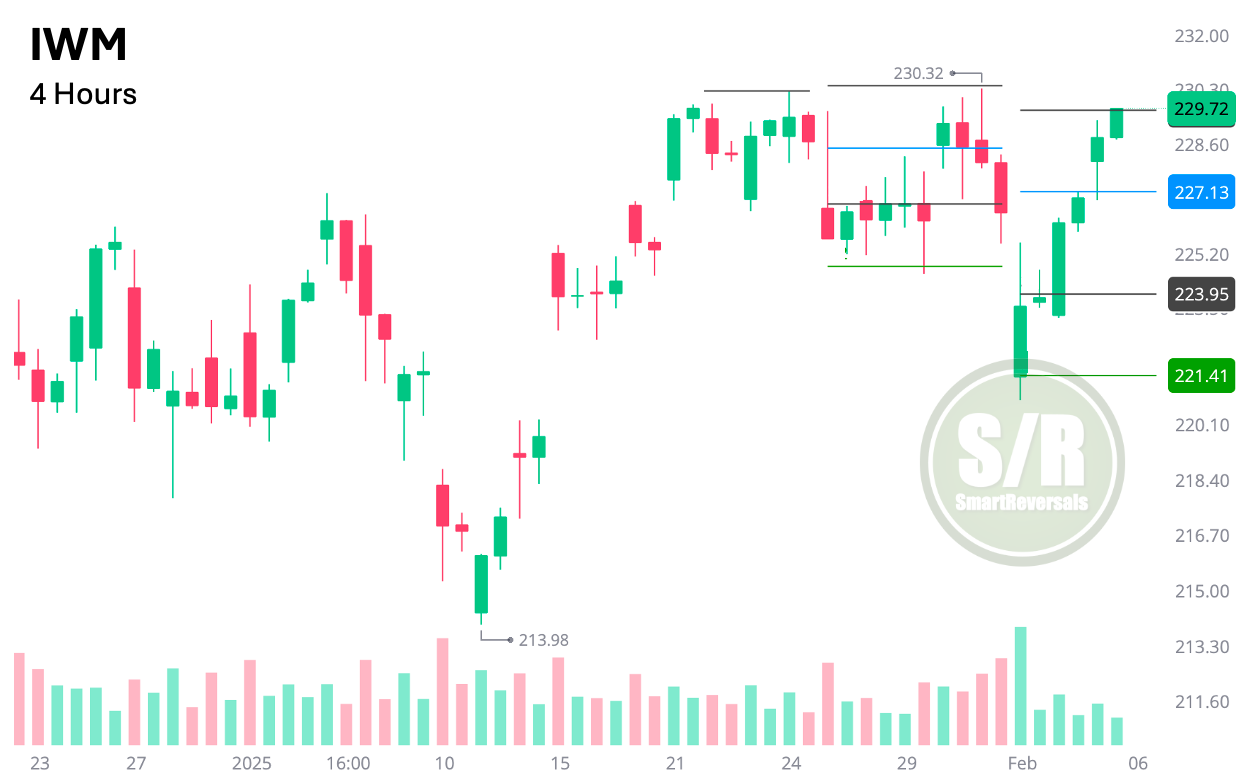
The Russell 2000 ETF (IWM) also demonstrated the effectiveness of these levels. The selloff extended to $221, the second identified support level (since last Friday), where the price swiftly reversed course. IWM is now approaching our projected resistance level of $229.6. everything consistent with the previous Weekly Compass: “Hiccup ahead before a potential bounce. || Potential bullish reversal target if the key level is recovered: $229.7”
Since the latest price action shows conviction, risk management continues around $227.3 for longs, and the candles are suggesting $232.8 is the next level on sight. That would be possible only if the market is not impacted negatively by AMZN. Yes, that is not a small cap, but IWM usually suffers the moves of the big indices.
SPY
Key level to continue as support to consider bullish continuation: $602.1 | Candles are suggesting $609 is the next destination, but considering the distance from here, I’d be watching every two hours the candles for potential fake outs (dojis, shoothig stars, gravestones, and similar, get access to educational content about candlesticks here). $594 is the bearish target if $602 is lost, that alternative is not considered for tomorrow, but for Friday if AMZN misses.
QQQ
Great bounce from $511.1; the bearish target mentioned last Friday (access here), since $521 has been conquered, $532 is the next bullish target, and $511 would be again on the radar if $521 is lost.
DIA
The bearish target posted last Friday was reached, price bounced right from $440.5 and struggled for one day and a half at the central level $445 before consolidating that level today, the current target is $450 unless the central level is lost.
TSLA
As mentioned in the latest Weekly Compass, the setup is for a consolidation and a slow-motion decline, right now $386 has been lost and an indecisive 4 hours candle has to confirm its potential bullish spirit recovering the level mentioned. Fundamentals are weak as analyzed last Monday in the Fundamental update for tech megacaps, access here. $367 is on the horizon this week if the 4H and 2H candles are wrong.
AAPL
Continues weak after price clashed with the higher Bollinger Band as shared for everyone last Monday, for now $226.3, an annual level charted last Saturday is acting as support. $234.8 is the level to consolidate any potential reversal.
FUNDAMENTAL UPDATE & LEVELS
This special edition of the Weekly Compass provides a comprehensive update on the major securities tracked, including the latest weekly and monthly levels. Crucially, I’m also including annual support and resistance levels for each of these securities, offering a longer-term perspective for strategic portfolio management. These annual levels can be particularly useful for identifying potential long-term entry and exit points. By combining short-term and long-term analysis, traders can develop a more nuanced understanding of market dynamics and make more informed trading decisions.
Let’s begin with the two most commented

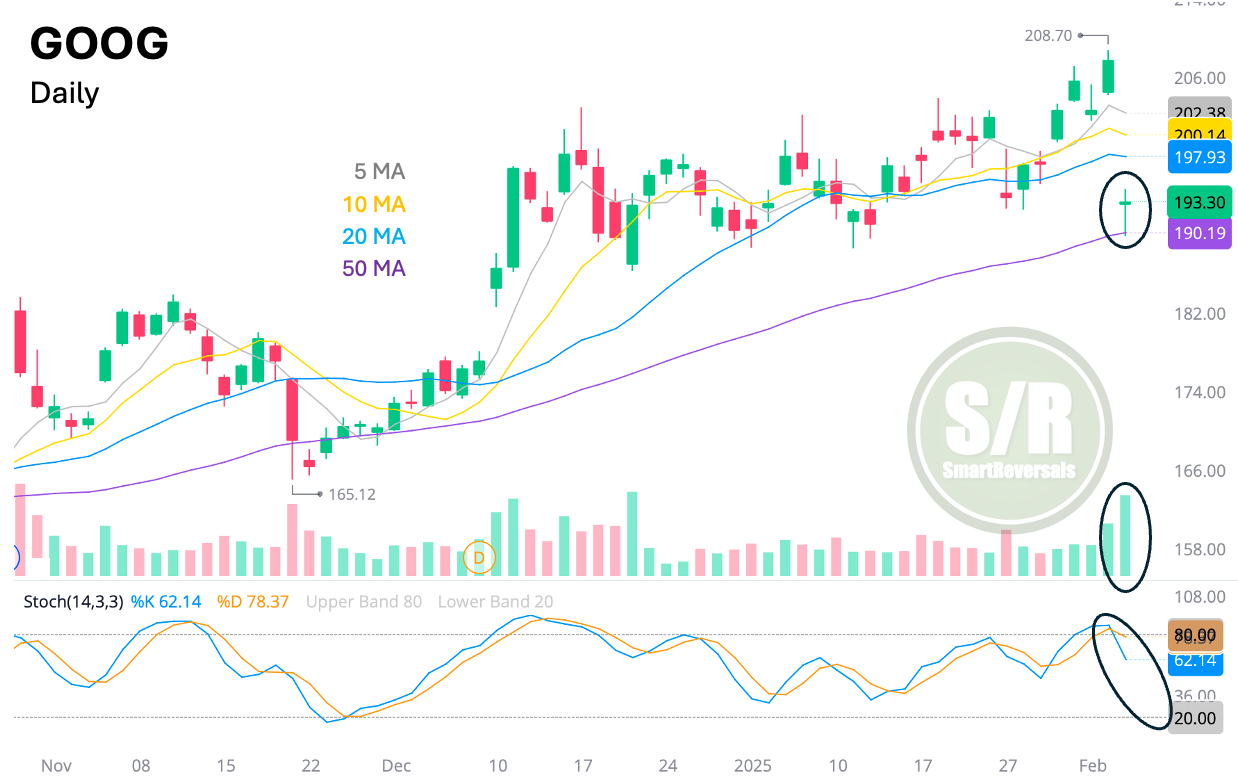
Google's Q4 results were a mix of positive and negative signals. Revenue slightly exceeded expectations at $81.6B (vs. $81.5B projected), thanks to robust growth in Search (13% y/y vs. 11% expected) and YouTube (14% y/y vs. 11% expected), both accelerating from the previous quarter. However, Cloud revenue growth slowed to 30% y/y (vs. 32% expected) due to capacity constraints, echoing similar issues at Azure.
EPS of $2.15 beat the $2.12 estimate, aided by lower sales and marketing expenses. Despite the strong performance in Search and YouTube, the Cloud shortfall and increased capital expenditures (FY25 guidance of $75B vs. $60B expected) for AI infrastructure development impacted the stock price. The potential of AI for Search and Cloud is promising, but competition and rising infrastructure costs are concerning. $219 is very likely to be reached in the coming months, when the market values Google's core search business, projected to grow 12-13% ex-FX in 2025.
Today’s dragonfly candle suggests a reversal considering volume validation and the bounce from the 50DMA, the gap will be filled, but Stochastic suggests the move is not over. Let’s use the levels: The dragonfly is at $193.8, a monthly support level, it may be a reversal zone, and $196 should be overcome to validate that thesis, if it doesn’t happen the bearish move should find support at $187.

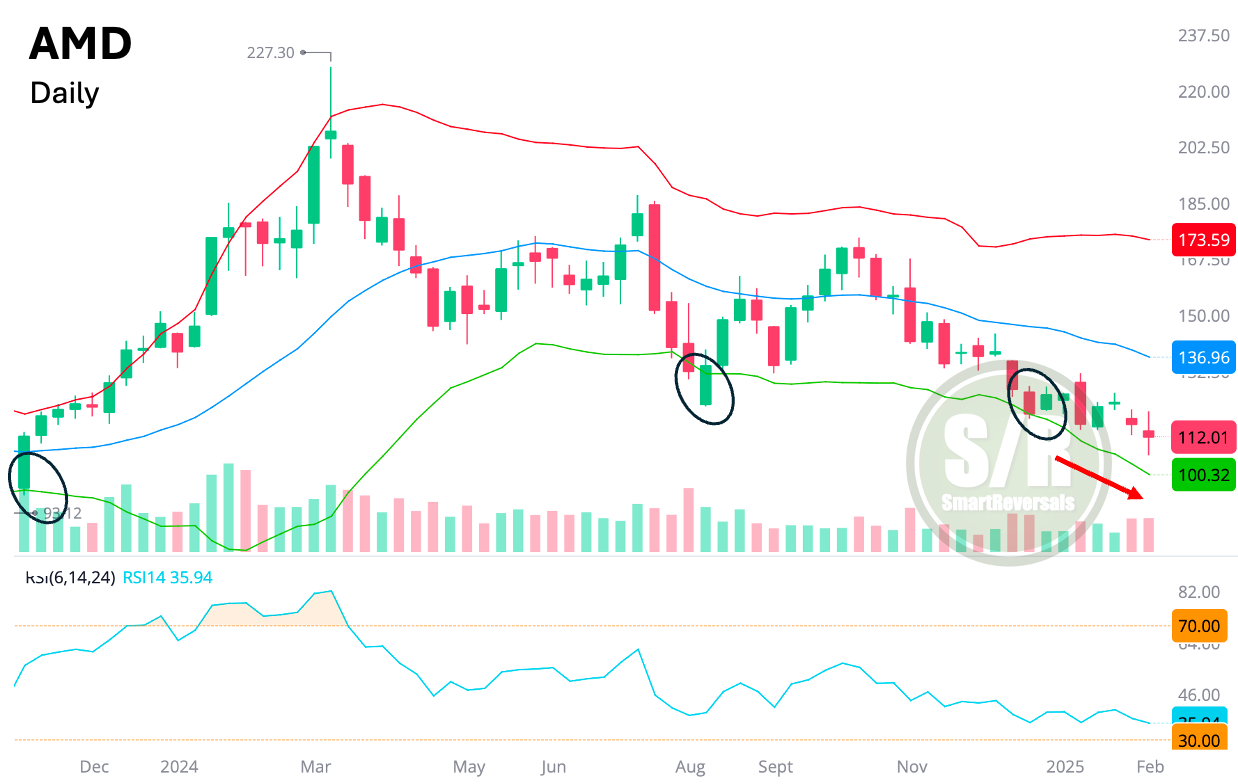
AMD's Q4 performance was in line with expectations, with surprisingly strong PC sales offsetting weaker-than-anticipated data center revenue. Q1 guidance also modestly beat estimates, again driven by consumer PC/gaming strength, contrasting with Intel's weaker outlook. For the crucial AI GPU market, revenue is expected lower.
AMD expects flat AI GPU revenue growth H125, with a stronger H2 due to the MI350 ramp. Overall, CY25/26 EPS estimates remain unchanged at $4.4/$5.5, as PC/gaming upside balances higher operating expenses. This context opens up the possibilities to reach $86 an any moment during the quarter, and reduces significantly the chances to reach $150, an annual level I expected to be visited but the ER changes that view.
While AMD is accelerating its MI350 launch and progressing with the MI400 for late 2026, capturing significant AI market share (currently under 5%) will require substantial investment in software, scaled deployment, and system integration. Nvidia's continued strong performance and the increasing adoption of custom ASICs by major cloud providers make it challenging for AMD to dominate the AI landscape, even with its own growth in the sector. Furthermore, AMD's increasing reliance on the cyclical PC and gaming markets, while potentially boosting revenue, could negatively impact profit margins.
The fact that price is far from the Bollinger band adds bearishness to the chart. $108 acted as support, $112 was the expectation for bearish target but weak earnings sent price to the next bearish level and the intra day bounce found rejection at $112.3, a level that has to be recovered to expect a bounce. (REMEMBER THAT EVERY LEVEL I MENTION HERE WAS PUBLISHED IN ADVANCE LAST FRIDAY). The bright side for AMD is the daily chart, where the Bollinger low has been visited, so a technical bounce is likely. Subscribers know that after $112, the level to watch is $116.4.
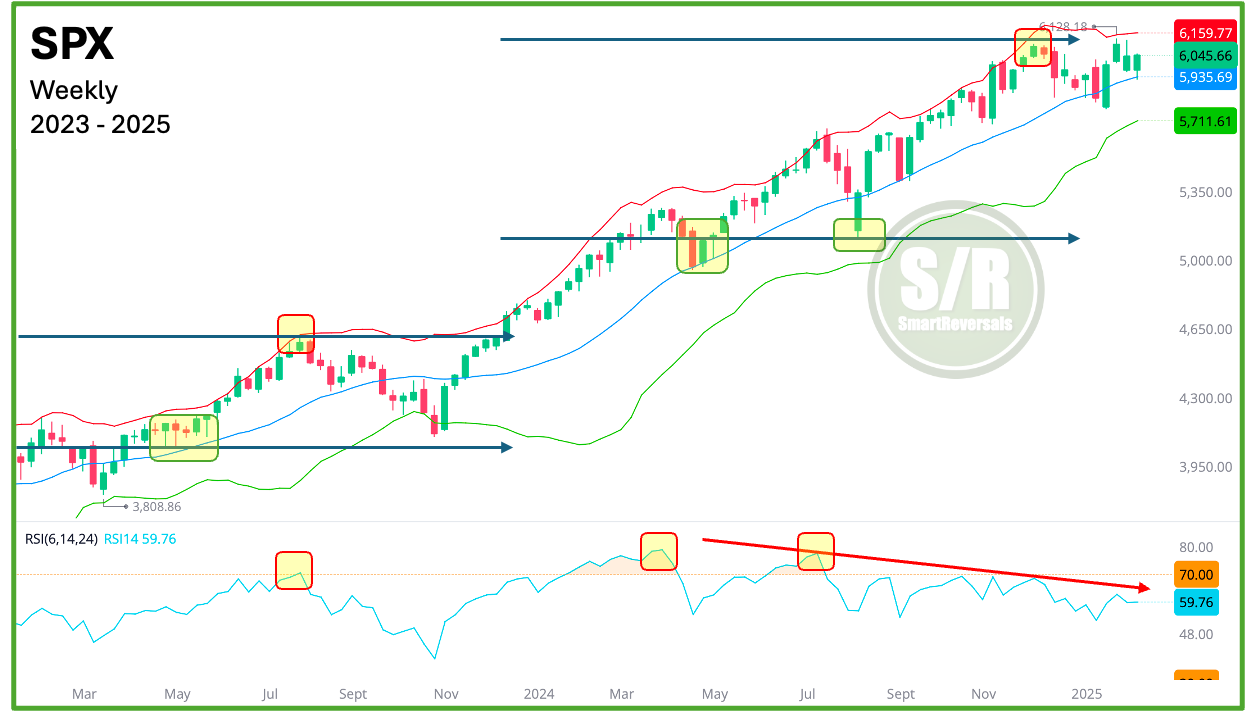
Let's now turn to PLTR and the 2025 ANNUAL support and resistance levels for SPX, SPY, NDX, QQQ, IWM, AMD, PLTR and GOOG. These annual levels have been instrumental in anticipating key reversals, such as the bearish turn at $4608 in July 2023, the subsequent bullish reversal that concluded in late October 2023, the bullish bounces in April and August of 2024, and my bearish call at $6,109. People who follow me long ago on X when this premium publication didn’t exist, remember the cases for 2023. The chart below highlights the levels.
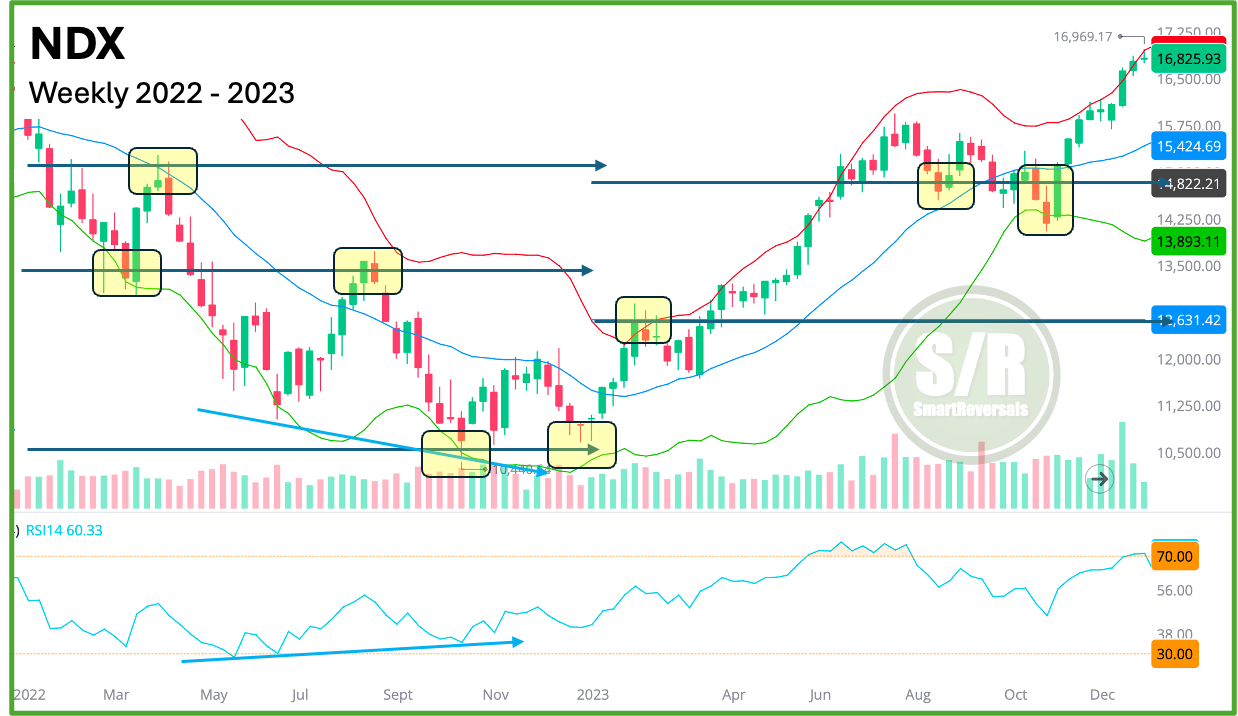
Backtesting this approach, the case is the same for NDX, with bearish reversals in 2022 as highlighted below, and the very bottom of the bear market was in an annual support level. In both charts the use of RSI and Bollinger bands has been essential.
Let’s continue with PLTR and the 2025 levels. This is a GOLDEN tool.