

The market declined today, driven by tech weakness and a sharp surge in December rate-hike odds. GOOG plunged -12.3% on weaker than expected revenue growth in its core search business, reigniting Wall Street anxieties over immediate returns on massive AI infrastructure investments. The weakness rippled across software and infrastructure peers: ServiceNow (NOW) plummeted -27%, Fortinet (FTNT) tumbled 20%, and MSFT succumbed to broader market pressure, closing lower despite reporting a strong quarter.
Macro headwinds compounded the selloff. Hot inflation data and resilient GDP readings prompted traders to aggressively recalibrate policy expectations, pushing the probability of a December rate hike up to 74%.
Price action remained choppy this week. The SPX chart posted here on Tuesday, highlighting a sequence of lower highs and indecisive candles, was validated as the index printed yet another lower high that is likely to stay as a high considering the bearish reaction to AMZN earnings.
After the bell, AMZN added further pressure to the tape, dropping -5% in extended trading following a top and bottom line miss. Q3 EPS arrived at $1.89 (vs. $1.97 consensus) on revenue of $201.9 billion (vs. $202.2 billion expected). In addition, the management held its massive 2026 CapEx budget at $220 billion, dragging trailing twelve-month free cash flow to negative $42.4 billion and sealing the post-market selloff.
Today’s Agenda
The Most Important Chart of the Week
Fundamental Analysis and Price Targets for GOOG and MSFT
Daily plan for SPX, ES=F
Daily and Weekly Levels Combined for tomorrow: SPX, ES=F, AMZN, GOOG, MSFT, NVDA, and other megacaps.
Watchlist Tracker
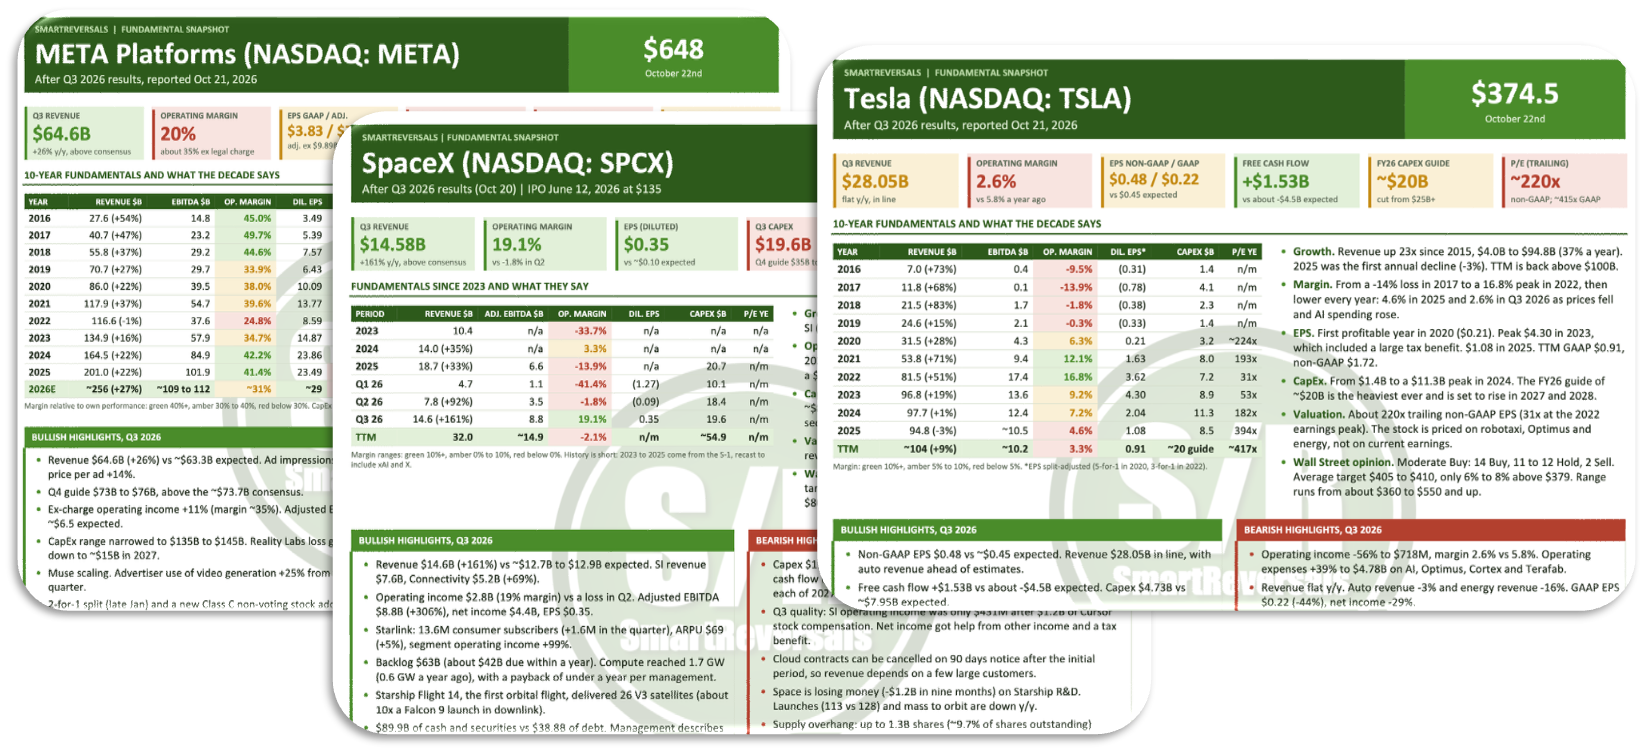
Unlock this institutional level research: I am adding comprehensive fundamental analyses to these daily market notes to expand our fundamental library.
Every release fundamental reality, providing 1, 3, and 12-month price targets based on EPS trends, CapEx, revenue growth, and business units analysis.
Full reports for META, SPCX, TSLA, GOOG, MSFT, NFLX, JPM, and V are ready to download here. Subscribe to access this information for both long term investors and traders.
Designed for speed and clarity, these one-pagers get straight to what matters: core business drivers, key financial inflection points, and multi-horizon price targets.
Let’s begin.
The Most Important Chart of the Week
In this space we studied the high probabilities for a spike in the VIX, the top in the NDX, and today a major level breached: