
The SPX Level You Need to Time Major Moves
Why ignoring this chart signal could mean missing the next big move - Support and Resistance Levels for Oct 6th - 10th


The US stock market concluded a strong week with major indices reaching fresh all-time highs despite an ongoing government shutdown and mixed economic signals. The primary catalyst driving gains was growing expectations for Federal Reserve interest rate cuts, amplified by the absence of official government economic data.
Let’s study some highlights from the week before diving in to a backtesting of the central weekly level for the SPX, and the reason why this level modeled every week is an essential tool for investors and traders. Remember, this level is modeled for the SPX and other 40 popular securities like futures, TSLA, NVDA, GLD, IBIT, ETH, AAPL, SPY, QQQ, IWM, and many more listed below.
Why the Stock Market Continues Afloat
Data Blackout Ironically Boosts Markets: The ongoing US government shutdown is producing a counterintuitive market effect. The absence of the crucial monthly jobs report and other official economic indicators has increased investor confidence in potential Federal Reserve rate cuts this month. With government data unavailable, markets are relying heavily on private-sector indicators like the ADP report, which showed the private sector shed 32,000 jobs in September—a figure that reinforced rate-cut expectations.
Extended Shutdown Risks: While stocks have largely dismissed the shutdown thus far, a prolonged impasse poses escalating risks and leaves the Federal Reserve “flying blind” when making critical monetary policy decisions.
Economic Data Reveals Sticky Inflation Amid Service Sector Weakness: ISM Services Index Hits Breakeven: The Institute for Supply Management (ISM) services sector gauge fell 2 percentage points to 50% in September—the precise threshold between expansion and contraction—missing economists’ forecast of 51.7%.
Critical Service Sector Shows Strain: Business activity within the services sector, which comprises over two-thirds of US economic output and roughly 65-70% of the CPI basket, declined to 49.9%, entering contraction territory for the first time since May 2020. The employment sub-index also remained contractionary at 47.2%, signaling continued labor market softness.
Inflation Pressures Remain Elevated: Despite the activity slowdown, the “prices paid” component—measuring input costs for materials and services—increased to 69.4%. This elevated reading suggests inflation, particularly within the services sector. This dynamic presents a challenging scenario: weakening activity coupled with persistent price pressures.
Cryptocurrency Market Extends Rally: Bitcoin as one of the five key indicators tracked for premium subscribers approaches to record territory and hovering above $123,000 per token so far, reflecting continued institutional interest and favorable market sentiment. The recent move is consistent with the cycle analysis posted last month:
The week’s performance highlights a market increasingly focused on Federal Reserve policy direction amid incomplete economic data, in previous years this would have been punished by the market, so far the price action suggests resilience until proven wrong.
It’s About Price Action
There have been four major bullish signals studied since April, back then their implications sounded unlikely, and as I mentioned in the Weekly Compass posted on April 26th, adapting to the new market conditions is key, and trusting in a breadth thrust is something that is gained only after living one with apathy, as it happened to me years ago, but the market has proven to me also during the years, that those signals are an “all in” signal, no matter the news of the moment.
Proof of consistency: Weekly Compass of April 26 - Click Here
The Power of the Central Weekly Level
Every Friday I post the support and resistance levels for the week ahead, and for 44 securities, among 7 layers of price, there is a central level that makes the difference between bullish and bearish conditions, and that level is used as an insurance for any invalidation of a bullish or bearish setup.
It’s been a while since the last time I posted a backtest of this level and how it helps to act algorithmically (Bullish above, bearish below).
This is the 4 hours chart for the SPX and the price action since April 24th, when the breadth thrust signal was triggered and I highlighted that new condition immediately in the paid subscribers chat that day.
The blue line represents the central weekly level (it’s one of seven modeled layers, but I’m only charting this key level to keep the visual clean). When the level is breached, there is a sell signal, when it is recovered, there is a bullish one (Always keeping some space below the level).
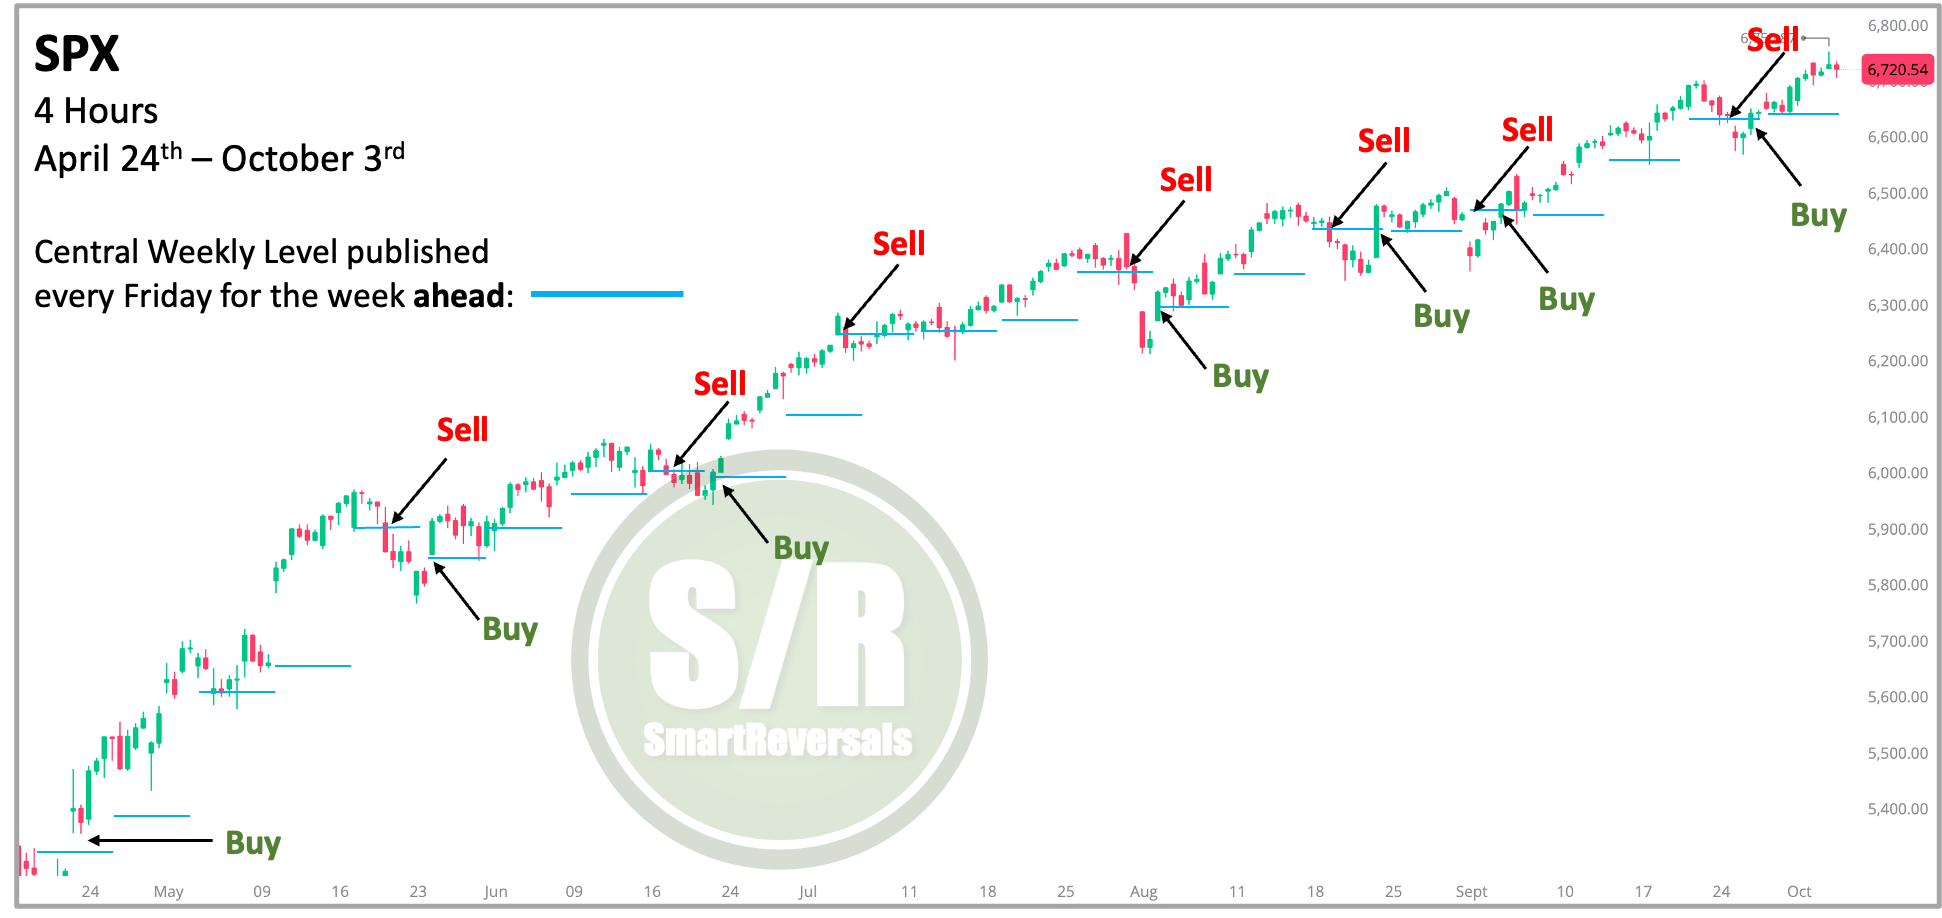
The visual speaks by itself: selling based on a daily or weekly candle alone can be a premature move, and shorting when the price is above the level can be even more risky.
There are weeks when the level is breached multiple times, but that does not change the power of using this insurance, and trading as any other career is about consistency instead of perfection.
That said, the Central Weekly Level, published every Friday for the week ahead, serves two primary functions: a reliable trigger and an effective signal filter.
1. High-Probability Trade Entry Signal (Trigger)
Bullish Entries (Buy Signals): When the price crosses and holds above the blue central level, it has consistently generated Buy signals, capturing the continuation of the underlying uptrend. It helps investors and traders buy the dip at a verified support level (after a pullback) rather than chasing the prior high.
Bearish Entries (Sell Signals): When the price crosses and holds below the blue central level, it has consistently generated Sell signals, capturing short-term pullbacks or significant reversals. It provides a defined exit or short entry point that capitalizes on a loss of weekly support.
2. Signal Validation and Avoidance of Invalidated Bearish Signals (Filter)
This level is crucial for filtering noise and validating the market’s true direction, specifically in avoiding premature or false bearish calls:
Validation of Bullish Strength: The level consistently acted as a dynamic support throughout the period. If the market pulled back but failed to significantly breach and hold below the Central Weekly Level, the underlying bullish trend was quickly reasserted (seen by the “Buy” signals immediately following a test). It confirms that a short-term pullback is only consolidation unless the level is broken.
Avoiding False Bearish Signals: By requiring a decisive breach of the Central Level to confirm a sustained downtrend or a deep correction, traders are prevented from falling for “invalidated bearish signals” (i.e., short-term weakness that doesn’t hold up). The level acts as the “line in the sand” that must be crossed for a bearish outlook to be technically justified. That said, it prevents aggressive short-selling during pullbacks that are destined to reverse higher, thus protecting capital by focusing only on verified technical breakdowns.
In short, the Central Weekly Level provides a clear, objective framework for trading the SPX, ensuring that decisions are tied to a significant shift in the weekly support structure, rather than temporary intra-week volatility.
This publication consistently analyzes the following securities to provide a broad market perspective and empower your trading decisions:
Indices & Futures: SPX, NDX, DJI, IWM, ES=F, NQ=F
ETFs: SPY, QQQ, SMH, TLT, GLD, SLV, DIA, SH, PSQ
Major Stocks: AAPL, MSFT, GOOG, AMZN, NVDA, META, TSLA, BRK.B, LLY, WMT, AVGO, COST, JPM, PLTR, NFLX
Crypto & Related: Bitcoin, ETH, IBIT, MSTR
Leveraged ETFs: TQQQ, SQQQ, UDOW, SDOW, UPRO, SPXS, URTY, SRTY
Upgrade your subscription now, and unlock all the educational content, the levels for next week, and the Weekly Compass with 20+ charts and price targets. Price action is showing exhaustion, have the right tools to navigate it.
Premium subscribers receive an additional benefit in the chat: extra levels for securities they suggest. Comment below this publication with the securities you would like to see published tomorrow!
WEEKLY LEVELS