
The Trend Is Bullish Until Proven Wrong
Some bearish setups have been invalidated - Managing risk and monitoring key indicators is essential to protect gains.


Some technical bearish conditions have been invalidated, others persist, but conditions can prevail for long, staying vigilant is better than fighting the trend.
Let’s start this edition with educational content about an indicator that raised yellow flags last week, but the S&P 500 continues moving up, is this an exception? or how does it compare with previous occurrences?
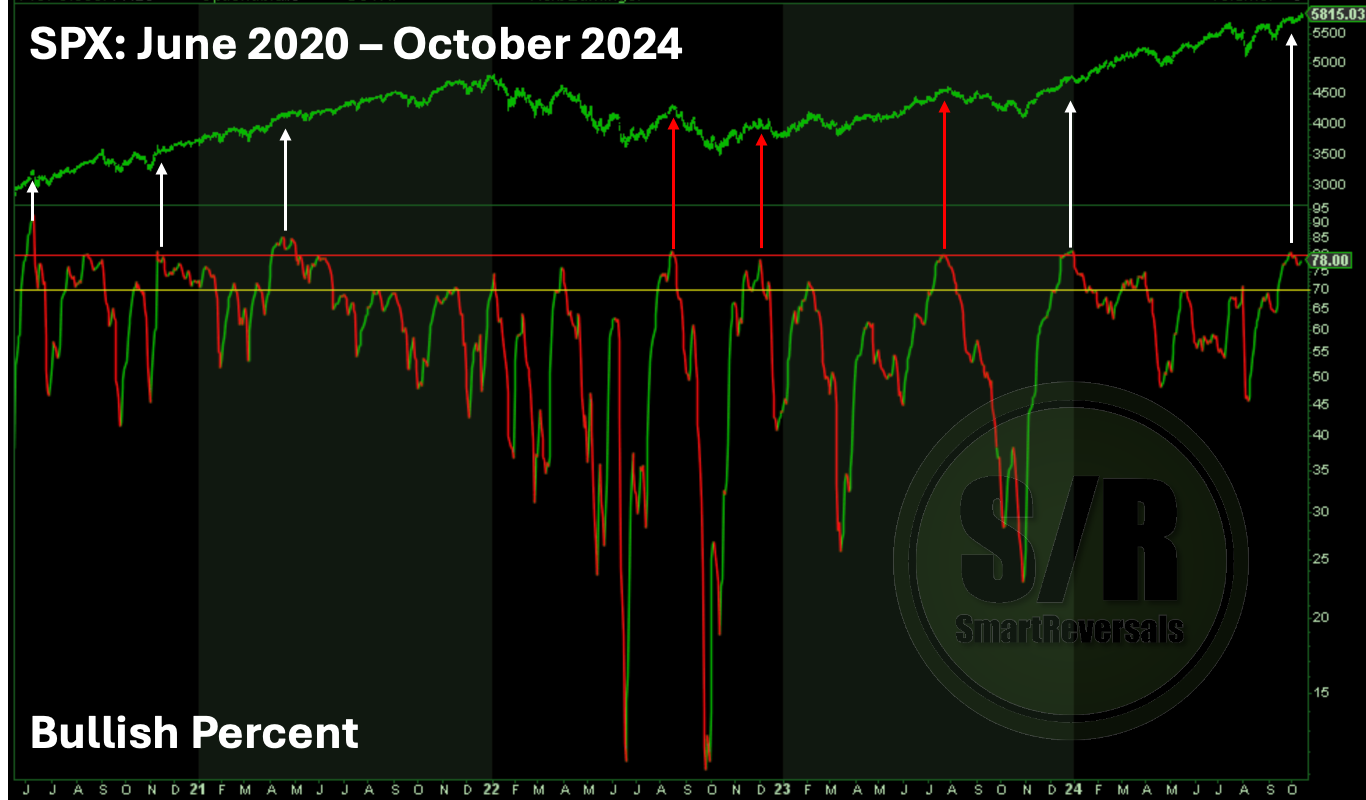
Bullish Percent - SPX
The Bullish Percent Index is a market breadth indicator that measures the proportion of stocks in an index that are showing signs of strength. This is how the index can be used when analyzing an index, in this case the S&P 500. Here is how you can use it:
Identify overbought and oversold levels: A BPI reading above 80% is generally considered overbought, suggesting that the market may be due for a correction. A reading below 20% is generally considered oversold, suggesting that the market may be primed for a rebound.
Look for divergences: A bullish divergence occurs when the BPI is rising while the market is falling, suggesting that a potential reversal may be imminent. A bearish divergence occurs when the BPI is falling while the market is rising, suggesting a potential correction.
Combine with other indicators: As all indicators, the BPI should be used in conjunction with other technical indicators, such as the Bollinger bands, Relative Strength Index (RSI) or moving averages, to confirm signals and reduce the risk of false breakouts or breakdowns. That’s the reason why last week, some technical indicators (5 and 1 macro) were set as must watch during the week.
Analyzing Reversals:
Consider bullish reversals when the BPI rises above 30% and is showing signs of bullish momentum.
Consider bearish reversals when the BPI falls below 70% and is showing signs of bearish momentum.
In the chart below, the white arrows indicate when the Bullish percent crossed the 80 level and when it reversed the S&P 500 didn’t do it, generating a bearish divergence that was painful for any short position or even for staying out of the index, since it did not stop moving up.
The red arrows present the cases when the Bullish Percent index crossed 80 and when it reversed the market also did it.
So far the index is staying at a high level, a bearish move can come in any moment, but there is no confirmation. When the S/R level $5730 was crossed on Tuesday, or when the market opened above it on Wednesday, there was a good reason to stay in long positions.
What About the Macro Indicators?
Rate cuts are bullish when there is no recession, and they’re bearish when there is a recession, for that reason monitoring macro economic indicators is essential, and that was the focus of study in the previous publication, including how they have behaved before or during recessions. There are warnings across the board, this edition alone is worth a subscription.

There are many analysts or accounts comparing the dates of rate cuts with the peak in the S&P500, this edition compares the peak of previous years with other indicators, making the case of why the market did not peak during the week that just ended.
The macro-economic indicators to track were included in Wednesday’s edition, the technical indicators to monitor are presented in this one.
There is a bearish condition that was invalidated during the week that just ended, this is a cause to stay attentive but not bearish, and the bullish target shared to subscribers a month ago already, is very likely.
This Weekly Compass includes the technical analysis, key annual and short term S/R levels for SPX, NDX, DJI, IWM, AAPL, GOOG, TSLA, NVDA, META, MSFT, AMZN, GDX, SILVER, DAX, BITCOIN, an new essential index for commodities; and last but not least, the 5+ contextual charts that help to understand the market. Let’s begin.
SPX - THE BULLISH NEWS: