
The VIX Awakens and the Bearish Warnings Came True
As Mentioned on Wednesday, The Top is In, and a Healthy Technical Reset is Underway. This Edition Includes Analyses to Gauge the Potential Depth of This Pullback.


Falling from the cliff, and Friday proved that complacency is over
Technical indicators may seem invalidated until they suddenly aren't, and the market recently made its final upward push before confirming the bearish setups that had been developing. The VIX jumping above its 20-day moving average (20DMA) on Tuesday, July 16th, was the key signal for the decline witnessed on Wednesday.
To end the week, the VIX closed above 13.8, a significant level long anticipated as confirmation of an impending pullback, which indeed began on Wednesday.
Tech stocks led the decline before the S&P 500 (SPX). Why? There was a significant rotation in the market. The chart below from July 18th provides a detailed illustration of this shift:

In line with the previous Weekly Compass, all seven mega-cap stocks performed according to their bearish setups.Notably, Tesla (TSLA) followed the script anticipated two weeks ago, forming a weekly indecision candle above the band last week, followed by the weekly decline that just happened.
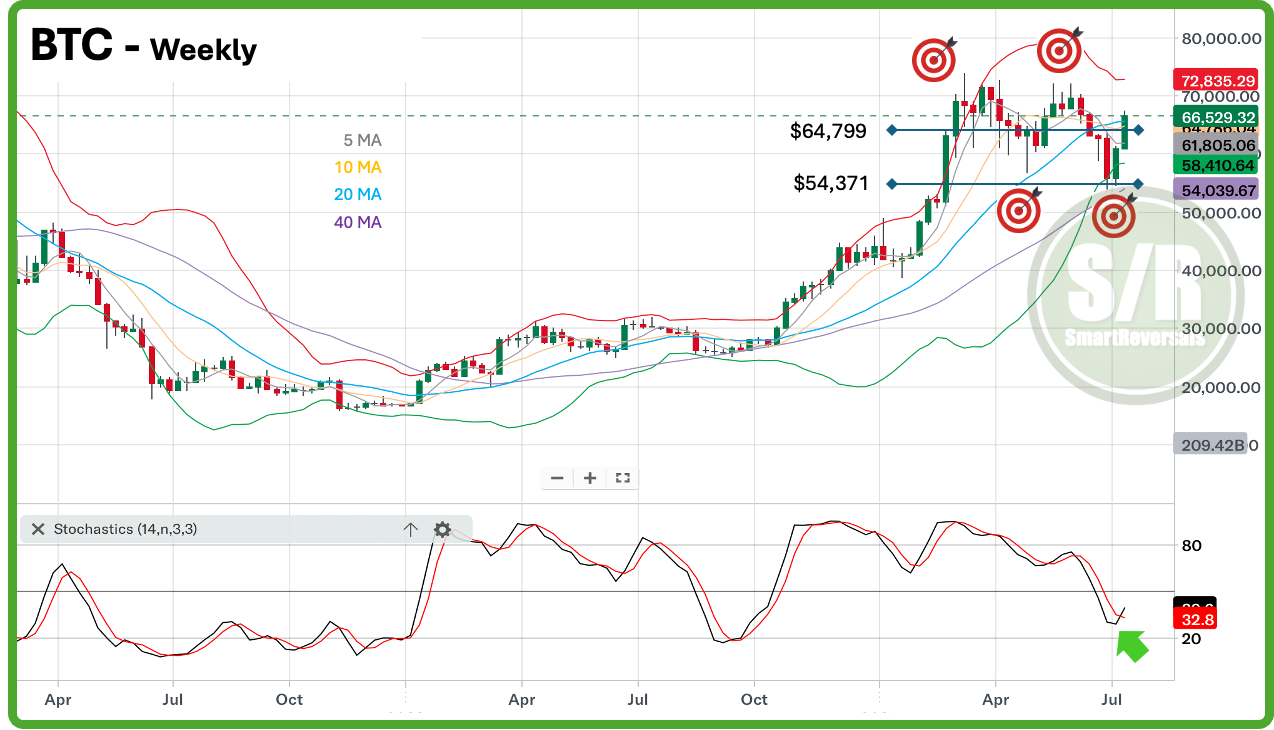
The divergence between Bitcoin and Tech stocks was also mentioned previously. Despite bearish setups in stocks, the Bitcoin surge was anticipated in this Trading Compass, similar to the previous two tops and the previous bottom when a hammer candle found support at the 20-week moving average.
This 20-week moving average must be surpassed by Sunday. So far, the chart looks promising, but if there's a retracement and the price closes below the blue line (and more importantly, the highlighted 64.8K level), with a high wick on the candle, Bitcoin could join the bearish party. This needs confirmation. The stochastic oscillator suggests this might be the start of a bounce.
Regarding the S&P 500 (SPX), there was a rapid improvement in breadth, as anticipated last week. This move did not lead to consolidation, just a last push to the peak but, more favorably for bulls, it triggered a breadth thrust signal. This indicates a high probability of new highs in the near future.
This edition of the Weekly Compass features additional SPX charts, aimed at measuring the current pullback's magnitude using objective metrics that have proven effective in the past (examples also provided).
Next week's Weekly Compass will also include additional charts, presenting more breadth thrust studies to provide further visual references for this rare event, which has occurred infrequently over the last 70 years.
During 2023, a similar signal emerged, but I doubted its significance due to the accompanying pullback. Next week could also see a decline, so I anticipate worsening sentiment. Thorough analysis is the best tool to understand the unfolding situation.
SPX