
Understanding Price's Invisible Boundaries
S / R Levels for May 27th - 30th - 40 Securities Analyzed


In technical analysis, support and resistance levels are like invisible lines in the sand where prices tend to pause or turn around. They're specific price points where buyers or sellers have historically stepped in with enough force to halt the current price movement and potentially reverse its direction.
Think of Support Levels as a strong floor for the price. When the price falls to this level, there's usually enough buying interest to stop it from going lower.
Conversely, Resistance Levels act like a tough ceiling. When the price climbs to this level, there's typically enough selling pressure to prevent it from rising further.
Using These Levels to Make Smarter Trades
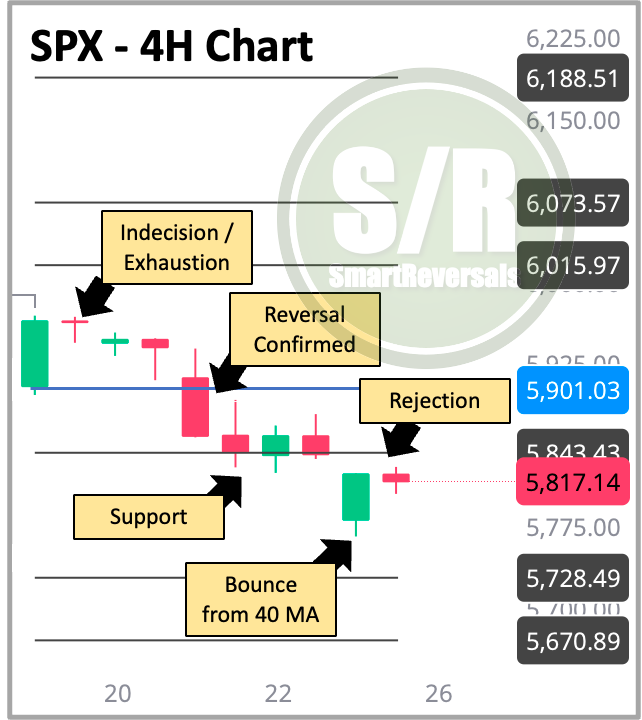
Let’s use the four hours chart for the S&P 500, the highlighted numbers are the levels provided last Friday, ahead of the week that just finished. The candlesticks alerted the potential reversal with indecisive moves on Monday and Tuesday, until the central level (blue line) was finally breached on Wednesday morning, when the bearish reversal anticipated by technical indicators in the previous weekly compass (click here) was confirmed. In this case the level worked to confirm the new trend.
On Wednesday and Thursday, the $5,843 level acted as support, but it was finally breached on Friday, flipping to resistance level and rejecting the bounce at the end of the week.
The low of the week was not exactly related with the S/R levels, but with the 40 weekly average, a key line analyzed in the Weekly Compass.
These "floors" and "ceilings" are vital tools for traders and investors to confirm whether a trade idea is solid or if a trend is likely to continue. Here is how we use them:
Spotting Reversals:
When Prices Bounce Up (Bullish Reversal): If a price drops to a known support level and starts showing signs that buyers are taking over (like bullish candlestick patterns or certain signals from momentum indicators), it validates a potential "buy" trade (like Monday morning when price bounced from the central level).
When Prices Turn Down (Bearish Reversal): Similarly, if a price hits a strong resistance level and starts showing signs that sellers are in control (like bearish candlestick patterns or negative signals from momentum indicators), it validates a potential "sell" trade.
Confirming Trends:
Breaking the Ceiling (Uptrend Continuation): When a price decisively breaks above a resistance level with strong trading volume and conviction (solid, large candles), it's a powerful signal that the uptrend is likely to continue (that was the case in mid-April when the market anticipated its bullish reversal).
Breaking the Floor (Downtrend Continuation): If the price crashes below a support level with strong volume, it means sellers have won, and the downtrend is likely to persist. A retest of this broken support (now acting as new resistance) can confirm the continued decline (Perfect example in the chart above when $5,901 and $5,843 were breached.
Setting Price Targets: These levels aren't just for entry; they're also great for exits. If a price breaks above a resistance, the next significant resistance level higher up can become your potential profit target. The same logic applies to bearish targets below broken support. In the weekly compass, the annual levels are charted, and those levels are used as mid and long term targets based on weekly timeframe and fundamental analysis shared with premium subscribers (that was the case for TSLA and $353 set as bullish target weeks ago; that level acted as resistance this week).
Managing Your Risk: Support and resistance levels are perfect references for placing "stop-loss" orders – For "buy" trades near support, you'd place your stop-loss below that support (see the chart above, the candles slightly breach the levels, so a lower price is best to avoid stops triggered). For "sell" trades near resistance, it goes just above that resistance. This helps limit your losses if the market doesn't behave as expected.
This Publication Helps You Master This:
Every Friday, I publish precise support and resistance levels for 40 different securities for the week ahead – yes, I'm setting these levels before the price moves, and there are five more securities since TODAY. Unlike models based on simply following trends, my method gives you levels set in advance, encompassing a range of price action with one central weekly level, three supports below, and three resistances above, all combined with monthly levels as well.
To truly understand and utilize these powerful tools, you need to be comfortable with candlesticks and oscillators. You can gain access to my full educational content, including dedicated sections on Candlesticks and Oscillators, by upgrading your subscription to paid.
The educational library alone (click here) offers immense value for anyone looking to gain a real edge in the stock market, all its articles studying bear markets, breadth indicators and rare technical signals were written during the last two months while the bear market was printing valuable charts to study in real time.
Upgrade and get all the resources available at www.smartreversals.com.
The Support and Resistance Levels are updated for 40 securities including: SPX, NDX, DJI, ES=F, NQ=F, SPY, QQQ, IWM, DIA, SMH, TLT, NVDA, META, MSFT, AMZN, GOOG, AAPL, TSLA, NFLX, COST, MSTR, PLTR, AMD, AVGO, LLY, UNH, BRK.B, PFE, GLD, SLV, BITCOIN, ETHEREUM, TQQQ, SQQQ, UPRO, SPXS, UDOW, SDOW, URTY, and SRTY. If you trade some of those securities, this publication is for you, and the information below will help you make informed decisions.
How to use the SmartReversals Subscription? - 3 Steps using AMD as Example:
The Weekly Compass analyzes every Saturday the technical setups for 20 securities including the U.S. Indices, Bitcoin, TLT, GLD, SLV, and Tech mega-caps. The AMD chart presents exhaustion in the rally and a very likely gap fill at $103.5; the top of the recent move matched the higher edge of the volume shelf and the 40 weekly average; the Stochastic RSI is curling down at overbought zone and the bearish target for the week that just ended was $108.6, which was the weekly support zone from where the price bounced on Friday morning.

The Weekly Support and Resistance Levels posted on Fridays, anticipates the central level for 40 securities. That level is the line that once breached confirms bearish or bullish reversals; for AMD the indicators anticipated exhaustion, the rejection last week from the 40MA suggested caution combined with the conditions analyzed last week for indices and the market in general. If 115.6 was breached this week, the bearish target was $108.6 (also included in the levels), and the low of the week for AMD was $107.7 before bouncing on Friday.

On Wednesdays, there is a market update with charts for SPX, NDX, Bitcoin, and the most notable securities, with a complete update of where the price is relative to the Support and Resistance Levels and the updated lines to watch. Each level has a definition relative to the week or month. Premium subscribers see the definitions in Fridays’ posts and the closest ones are part of the technical charts.

Also on Wednesdays, special studies are published, the most recent ones are in the :

In May the S/R Levels edition has been enhanced twice, and there is more coming to SmartReversals. Upgrade your subscription and lock your price now.
Remember to like🩶this publication, considering the model amplified to more securities👍. The enhancements applied to the Fridays publication will be followed by audio content as mentioned some weeks ago.
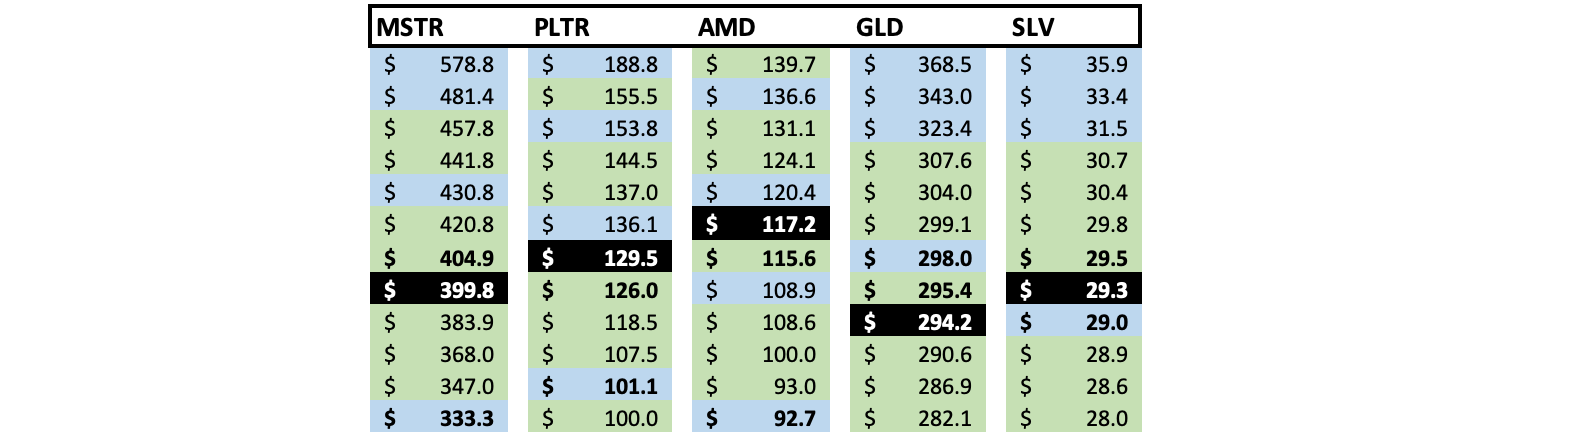
WEEKLY LEVELS
For new premium subscribers: The black arrow highlights the column where the central level for next is analyzed versus the closing price of today, then the characters are red, the security is set for bearish continuation unless the price spikes in the percentage indicated: