

Last week the Weekly Compass presented 12 setups 10 reached their targets, 1 neared their target, only 1 moved in the opposite way. or remained constructive, resulting in a 91.6% effectiveness rate.
The targets were based on these modeled support and resistance levels, and I was doubtful of some of them reaching their target considering the previous two rally weeks, but once again, these levels frame price action and in the same way that they worked in bearish weeks during march, they worked well during this bullish move.
Top Performing Setups
Bitcoin / IBIT: This was my high-conviction play regardless of broader market action. IBIT hit the extended target of $43.7 and closed the week at $43.9, delivering a robust +5.7% move. If you trade Bitcoin the move is even better for a +9% this week so far. Bitcoin has a very high probability setup.
NVDA: The bullish move based on the volume shelf acting as launchpad sent the price to the extended target of $200.4. The stock exceeded expectations, closing the week at $201.6 for a +6.9% gain.
META: I have highlighted its fundamentals and oversold technicals. From the extended target of $684.8 (+8.7%), the stock surged to close the week at $688.5 with a +9.4% move.
ETHA: The extended target was $18.1 (+6.4%). The ETF closed the week at $18.37.
QQQ: The extended target was $663.3. The index reached $648.0, marking a strong +6.14% weekly gain that exceeded expectations.
AAPL: The target of $266.5 (+2.3%) was easily cleared, with the price closing the week at $270.0 (+3.67%) actually nearing the extended target of 272.6 today during the day.
Target Hits and Technical Discipline
NFLX: The stock reached and exceeded our extended target of $106.8 (+3.7%) prior to its earnings report.
Strategic Note on Earnings: As seen with recent price action, the market is punishing stocks that do not provide perfect guidance. Trading through earnings is a lottery; setups can flip instantly regardless of technicals if the Street finds something unappealing. Same as 3 months ago, if a bullish target is reached, locking gains is prudent.
JPM: Despite initial weakness, the price stayed above our invalidation level (CWL) of $304.6. It trended bullishly toward the $316.5 target, reaching a high of $314.9. Given the proximity, we consider this move constructive.
Bounces: The expectations for relief bounces in PLTR, TSLA, and V all materialized.
Invalidation (1 out of 12)
LLY: This was our only outlier. It lost the $934.0 invalidation level, ending the week down -1.3%. While the structure remains somewhat constructive, it must recover key levels to reclaim the bullish thesis.
That said, the Support and Resistance Levels proved their worth allowing us to anticipate potential targets and managing risk in the case of LLY thanks to the Central Weekly Level (CWL) that was breached.
Looking Ahead
The levels for the coming week are posted below, identifying the “Bullish Above” and “Bearish Below” zones for both the weekly and monthly timeframes. We will analyze the charts in full tomorrow to identify which securities have the highest probability of continuing their bullish momentum.
Securities Analyzed Constantly Every Week:
Indices & Futures: SPX, NDX, DJI, IWM, ES=F, NQ=F
ETFs: SPY, QQQ, SMH, TLT, GLD, SLV, DIA, VXX
Major Stocks: AAPL, MSFT, GOOG, AMZN, NVDA, META, TSLA, BRK.B, LLY, WMT, AVGO, COST, JPM, XOM, PLTR, NFLX, V, AMD
Crypto & Related: Bitcoin, Ethereum, ETHA, IBIT
Leveraged ETFs: TQQQ, SQQQ, UDOW, SDOW, UPRO, SPXS, URTY, SRTY
The SPX is the core of this publication, and the rest of the watchlist combines sectors and assets, always with one principle: High Daily Volume that allows you to fill orders rapidly and use the options market if preferred.
Subscribe and get my two eBooks on technical analysis in my welcome email.
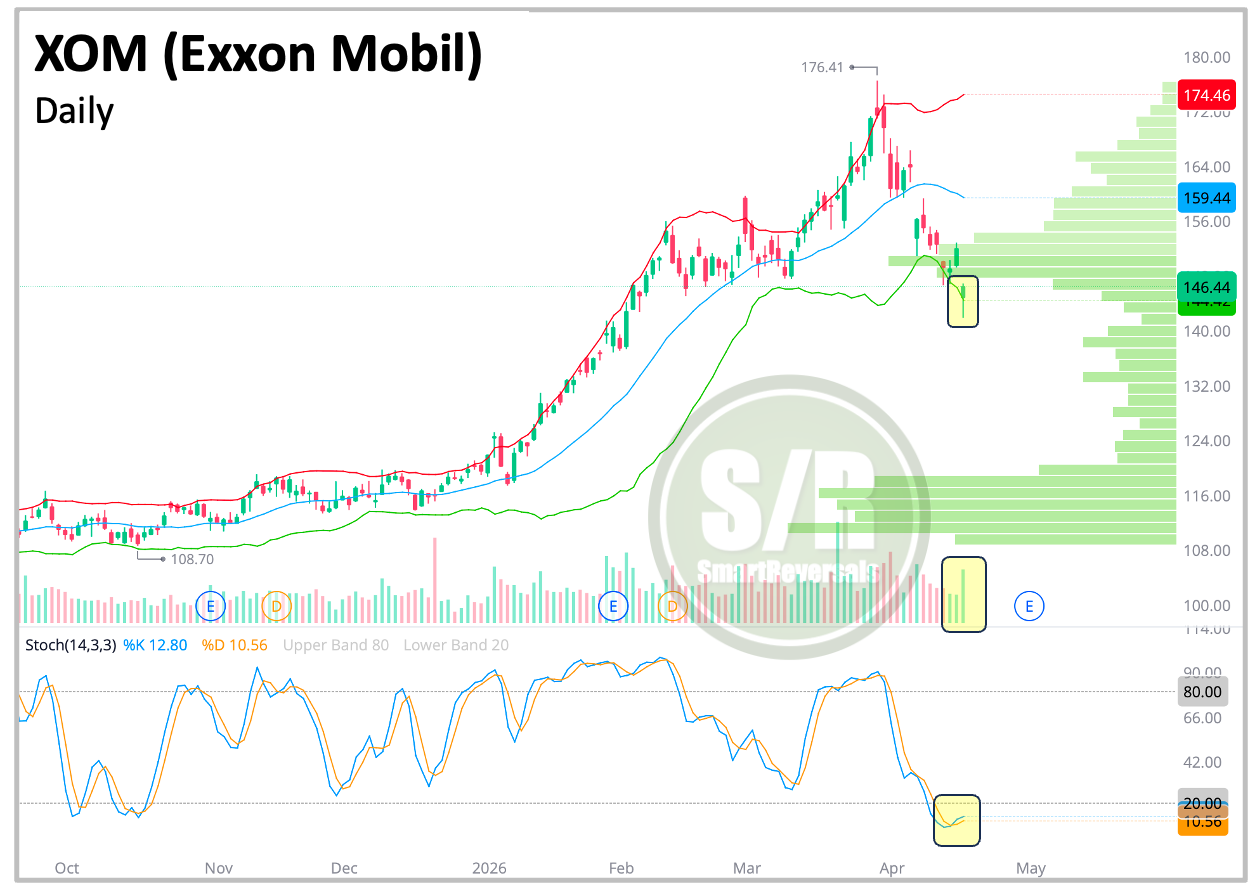
Intriguing Chart : XOM
Hammer candle with high daily volume breaching the lower Bollinger band, oversold oscillator, a gap above today’s candle, and a gigantic gap when considering the volume at price (green horizontal bars). This is usually a good combination for a bounce.
Dead cat or a sustainable one? The answer is in the S/R levels below.
Let’s begin.
WEEKLY LEVELS
