
Using Levels to Manage Risk and Entries
Unlock Safer Trades and Disciplined Risk Management Through Strategic Levels


Yesterday, the main indices of the stock market found support at the week’s specific central levels modeled last Friday: the SPX bounced at $6,702, the NDX reversed just shy of $24,749, and the IWM momentarily breached $244.4 before rebounding. All three of these levels acted as support once again before the market bounced today.
Since the market bounced from the specific central levels with precision, I decided to elaborate on the relevance of those levels, last Friday you saw the SPX chart with the central weekly level and how useful that line has been every week to keep us apart from premature decisions. Today we will study the central weekly level and the immediate bearish target for the week (both part of the seven layers of price modeled every Friday), for QQQ, TSLA, and NVDA.
The stock market update is below this educational piece.
Support and Resistance Levels
Trading and investing is essentially about analyzing the probability of a price move using technical indicators while maintaining confidence in the underlying fundamentals. That approach is enhanced when support and resistance levels are used to validate bearish or bullish setups, and during these days, we’re in defensive mode in case of a pullback comes based on how overheated the indices are.
The following SPX chart was published last Sunday in the Weekly Compass, and apart from the overbought RSI and bearish divergence with the oscillator (both conditions that have anticipated a pullback in the recent past as highlighted), the chart showed at the top left a set of support and resistance levels. $6,702 is underlined since it is the central weekly level, the line that is modeled every weekend ahead of the new week, and that level is the one that makes a difference between bullish and bearish momentum.
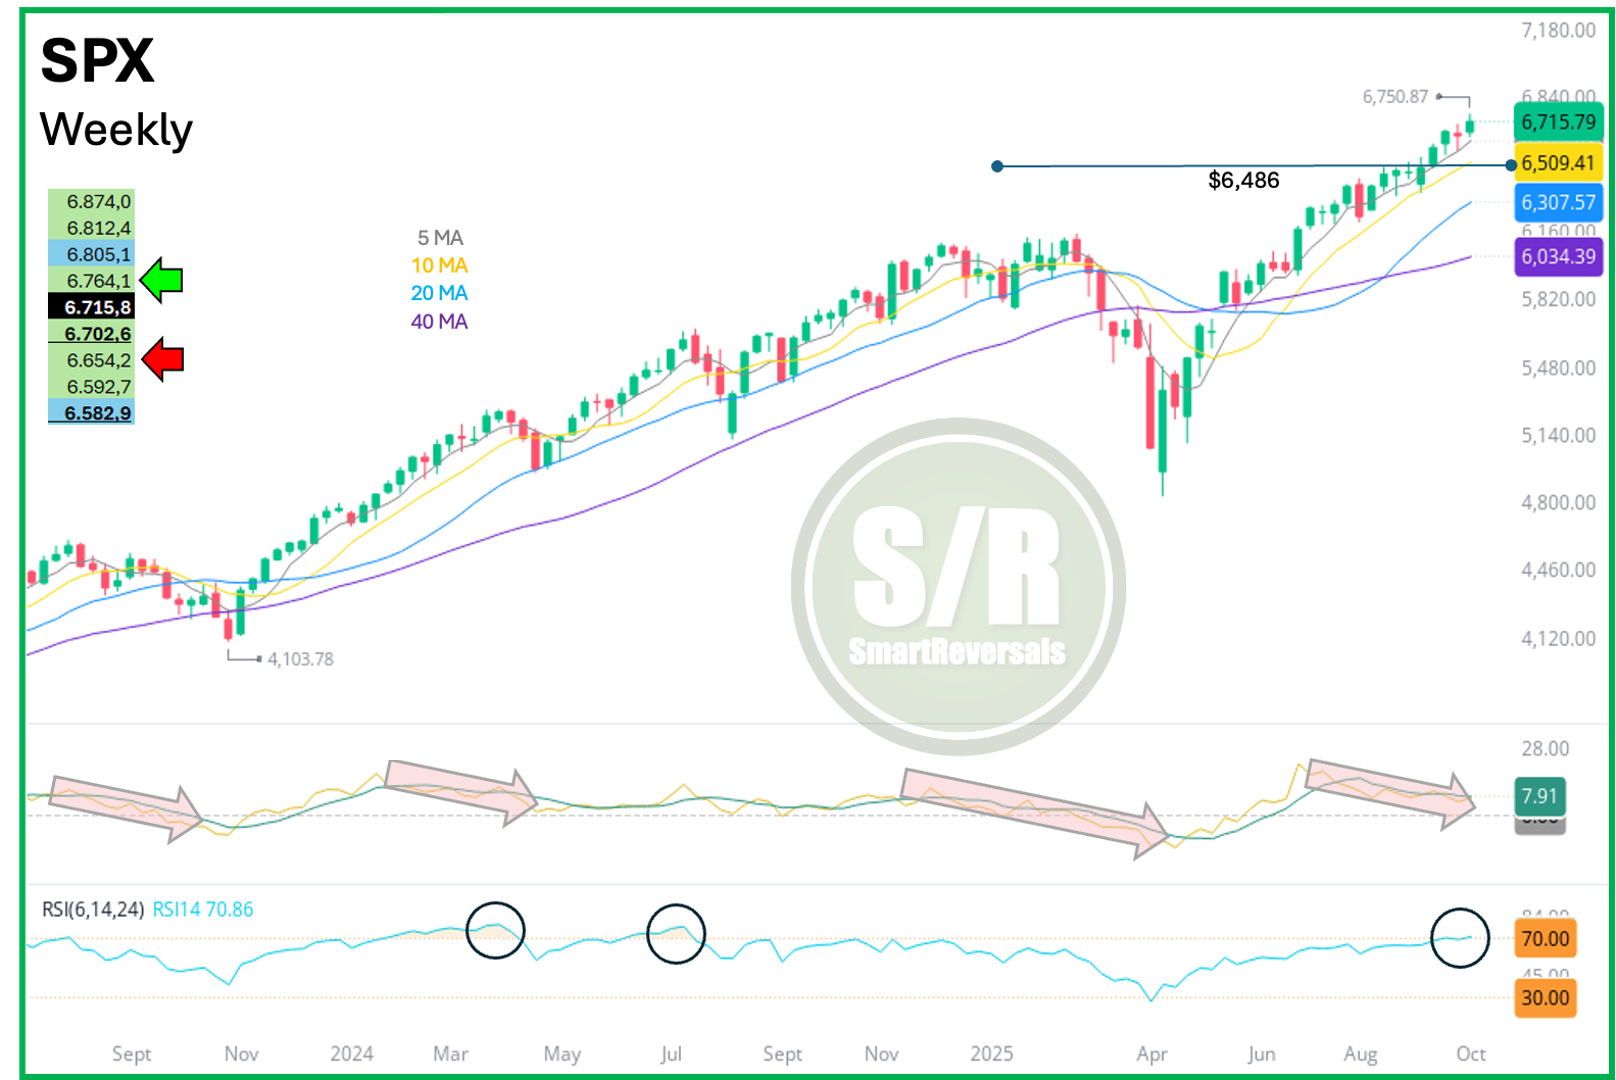
The central Weekly Levels since April:
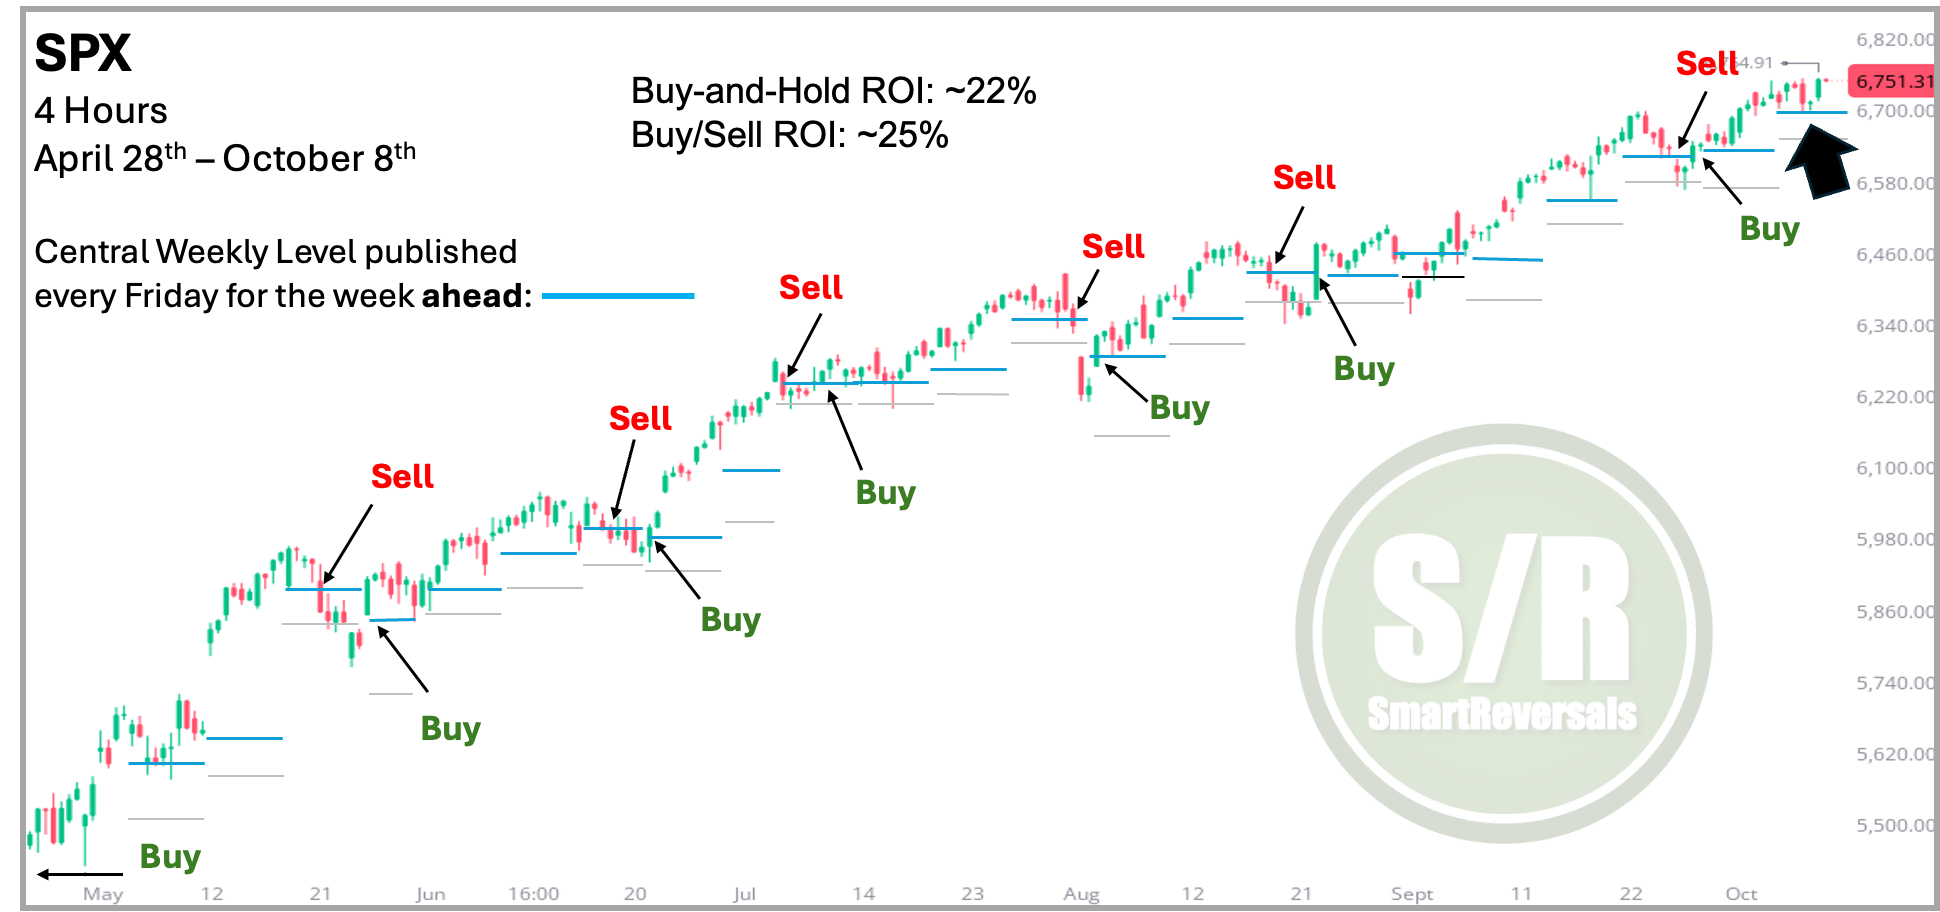
The blue line is the central weekly level, and in this case, the support line that follows, also mentioned in the Weekly Compass as “Immediate bearish target” is included in gray. From the chart there are two conclusions about using the central weekly level:
It has been breached very few times during this rally, providing validation of bearish setups. However, the character of this bull market is special considering not one, nor two, nor three, but four very rare bullish signals that have occurred since April, all of them have been documented individually for premium subscribers (links below).
When the central level is mastered with discipline, it can help a swing trader or investor to outperform a buy and hold strategy, in the case of SPX a couple of points, but we will study for TSLA and NVDA that it can enhance performance in a larger way.
The Major Bullish Signals are:
The last link of the list has a very clear measurement of where we are in the current bull market. For new subscribers, I base my analysis in a comprehensive study of historical charts.
The Central Weekly Level in Other Securities
Using support and resistance levels is a critical strategy for managing risk and achieving safer trade entries. Support levels act as a floor where a stock’s price tends to stop falling due to buying interest, while resistance levels serve as a ceiling where selling pressure often prevents further rises.
By identifying these levels, traders can set clear entry points once the central weekly level is recovered, and exit points when it is breached, reducing the risk of entering or exiting at unfavorable prices. Remember that any support line can be temporarily breached, for that reason any stop loss can be set below that line, colored with blue in today’s charts. How lower should a stop be set? That depends on the risk aversion of each person, we will study with TSLA and NVDA using the bearish weekly target as line in the sand, the result is quite interesting.
QQQ
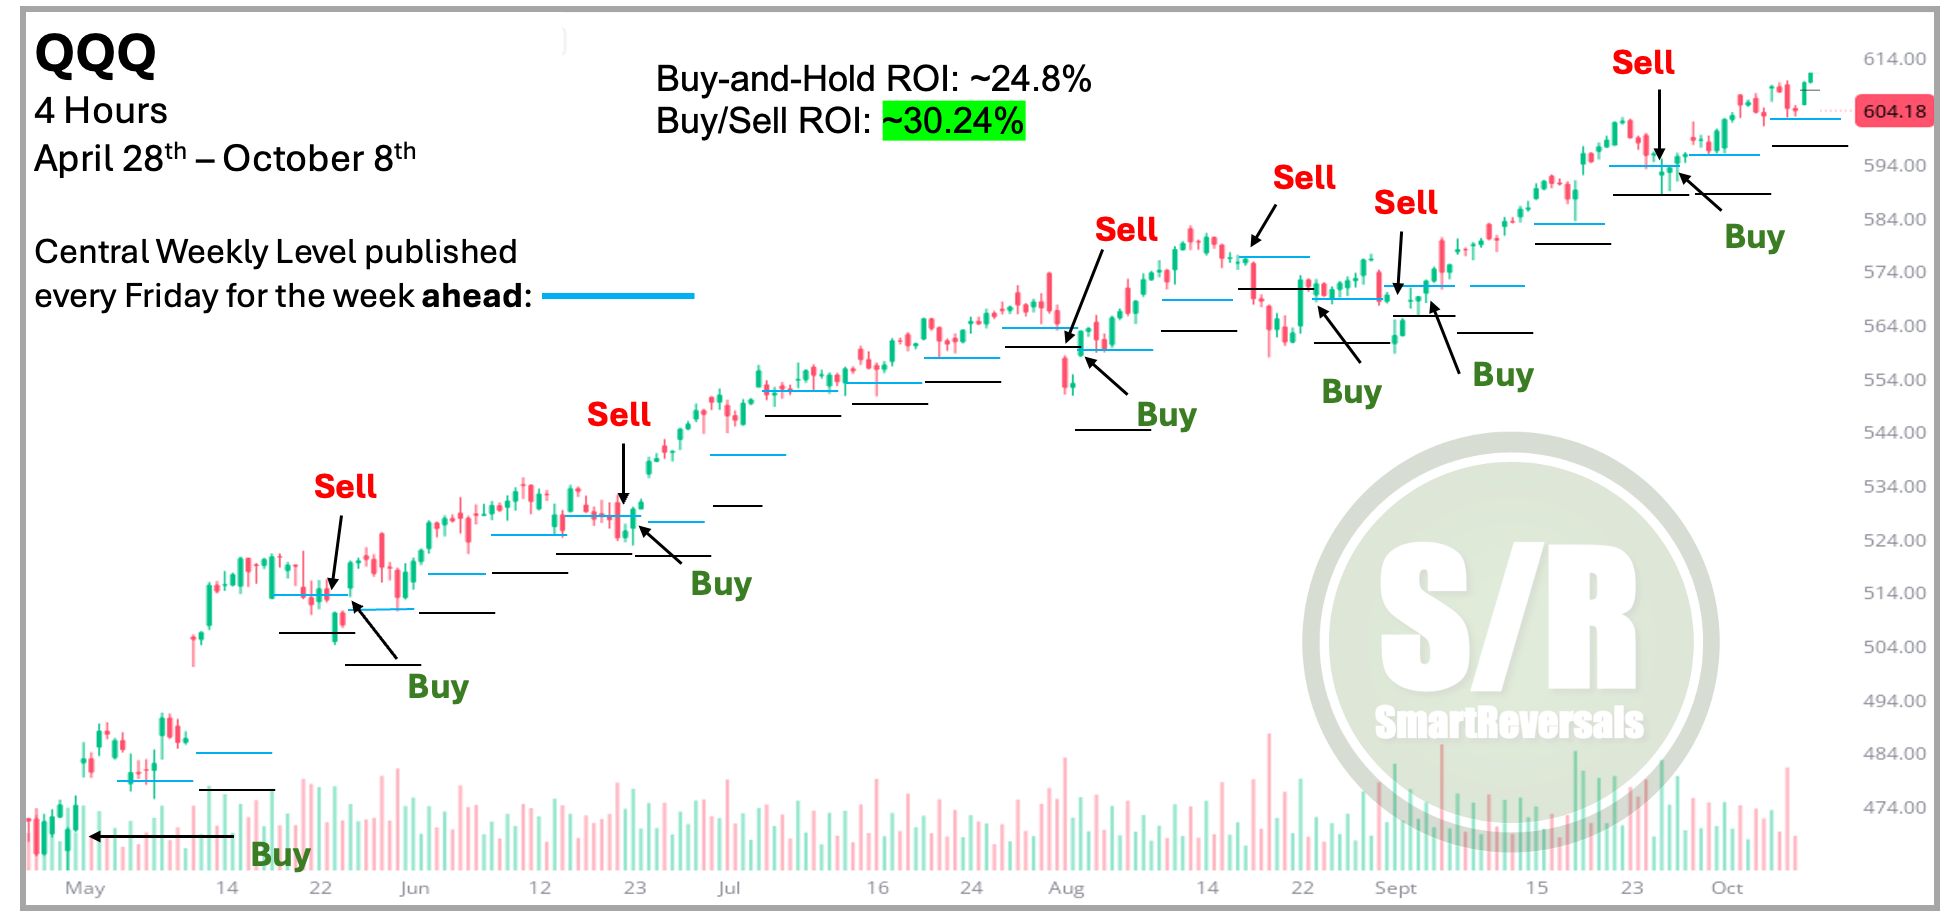
When analyzing this ETF, the validation power is the same as for the SPX, and in this case the central level can work well to time entries. However, the dips have been bought so quickly since April, so the exercise of gaining five additional points in gains (30% versus 24.8%) can be reached in an easier way with a leveraged ETF when there is conviction about a bull market.
Important note: If you haven’t bought and sold using central levels or you haven’t used leveraged ETFs (TQQQ, SSO, UDOW, etc), you should paper-trade before doing that with real money. Why paper-trade? The charts do not capture the news, the social media, nor the futures or extended market hours; when you manage your emotions considering those aspects, and you perform well, you’re in a better condition to swing.
Better Performance in Volatile Securities
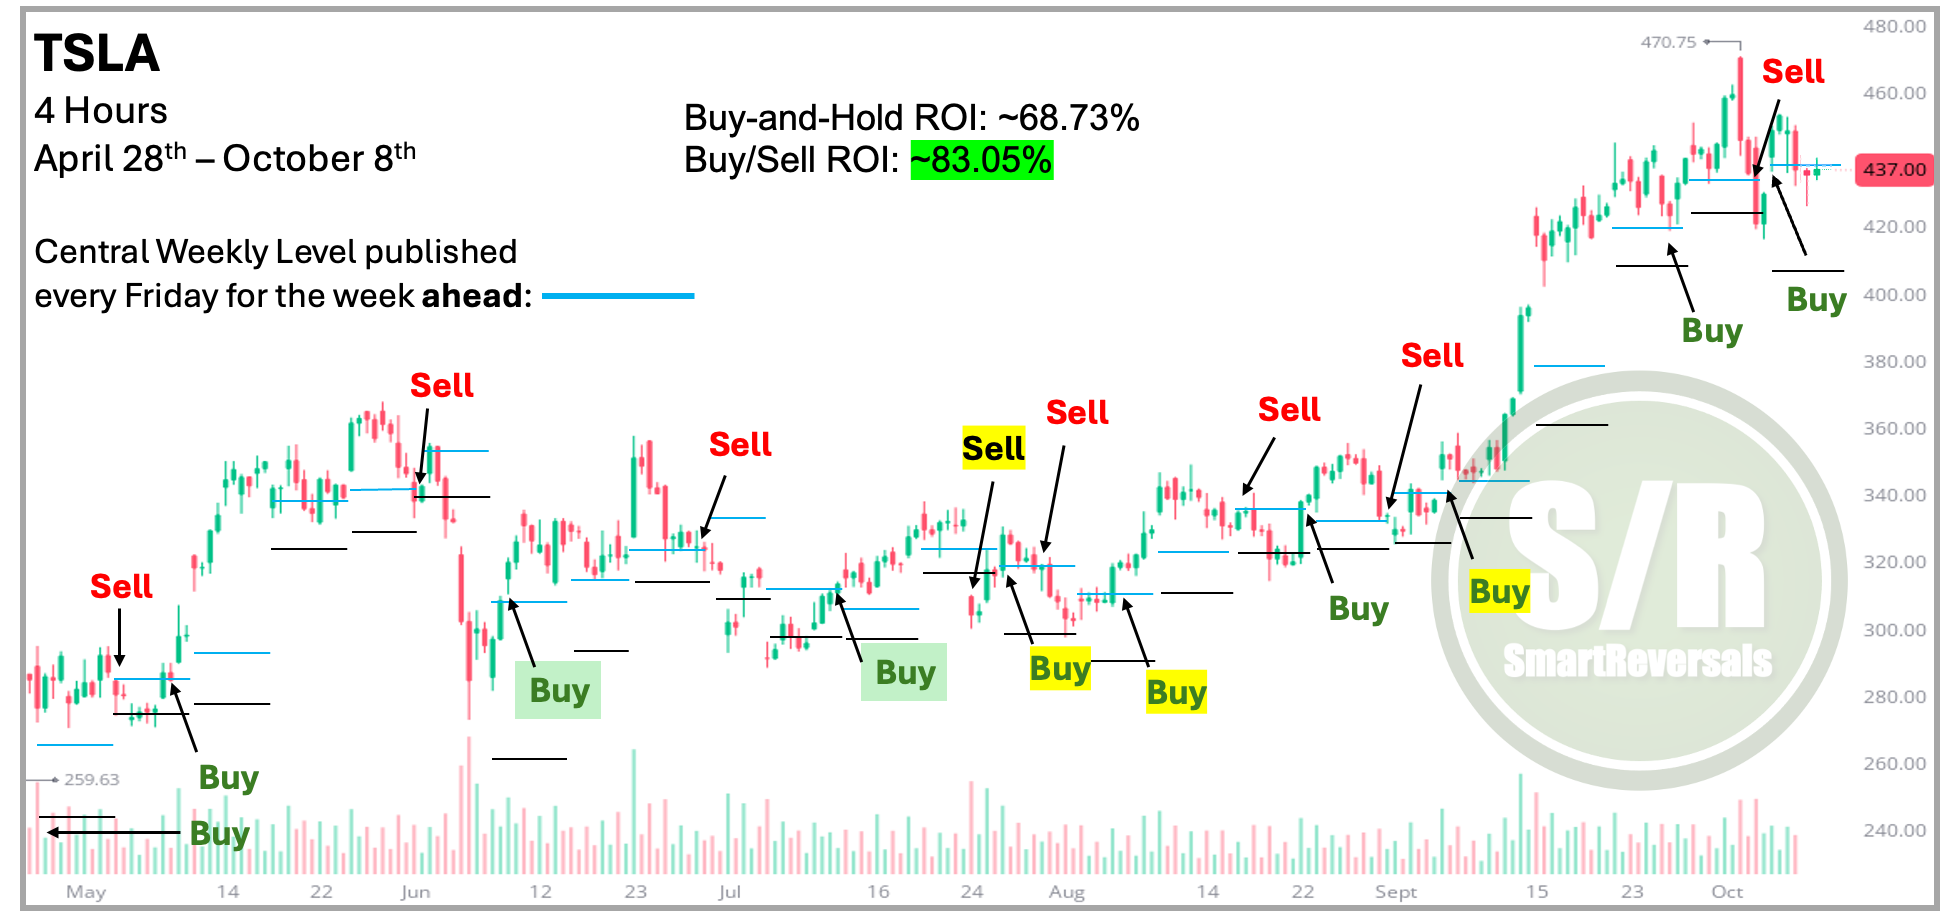
The analysis for TSLA, another security that is analyzed every week along with more than 40 securities, shows an interesting case considering three conclusions:
The central weekly level serves to validate bullish or bearish setups for this security, similar to its function for the SPX and QQQ.
The disciplined approach (buying when the price is above this level and selling when it’s breached), performs significantly better here than for the major indices. The improvement is approximately 15 percentage points. This figure is conservative, as I’ve already adjusted the difference downward to build in a comfortable cushion.
Trading and performance is not about perfection, it’s about following the process, since the levels are modeled every week and there are gaps or rapid moves that bring volatility to price. You can see some “Sell” and “Buy” signals that are highlighted in yellow; those cases show selling below the buy point, and buys above the previous sell point.
This publication consistently analyzes the following securities to provide a broad market perspective and empower your trading decisions:
Indices & Futures: SPX, NDX, DJI, IWM, ES=F, NQ=F
ETFs: SPY, QQQ, SMH, TLT, GLD, SLV, DIA, SH, PSQ
Major Stocks: AAPL, MSFT, GOOG, AMZN, NVDA, META, TSLA, BRK.B, LLY, WMT, AVGO, COST, JPM, PLTR, NFLX
Crypto & Related: Bitcoin, ETH, IBIT, MSTR
Leveraged ETFs: TQQQ, SQQQ, UDOW, SDOW, UPRO, SPXS, URTY, SRTY
This publication has the weekly and monthly levels for those securities, unlock this golden tool that has proven effective to navigate this bull market.
Let’s continue:
There is an interesting finding that works for the SPX, QQQ, TSLA, and NVDA, see below how the performance of using the levels jump from 83% to 97% for TSLA: