
Volume's Secret Message: Decoding Price Action with Volume at Price
See What Others Miss: Unveiling Hidden Insights with Volume Analysis, Fresh Examples Including Bitcoin, Ethereum, SP500, Tesla, AAPL, IWM and PayPal


This is the third installment in a series of publications dedicated to price action analysis. The first edition explored volume in different timeframes (daily, weekly). The second delved into candlesticks, providing real-world examples of price formations. This edition tackles volume at price. And wait, there's more to come, the series will continue with a highly valuable tool specifically designed for day traders. I have not seen information about it on social media.
The weekly chart for ETH shows volume in a timeframe, candlesticks formations and the topic for today: Volume at Price.
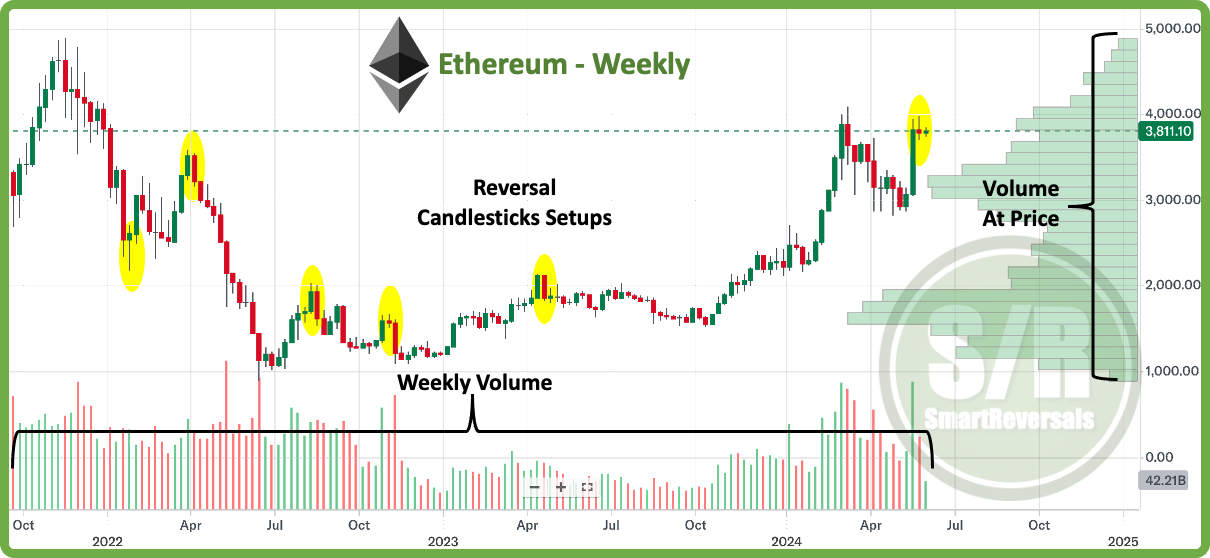
Volume at price (VAP), also known as volume profile, is a technical analysis tool used in trading to understand the relationship between trading activity and price levels for a particular security
Understanding VAP: