
Weekly Stock Market Analysis - Warning Signs Came True
Market Cracks Widen - Five indicators to watch

Throughout the fourth quarter of 2024, I maintained a bullish outlook, even while many people anticipated a red September or a resume of the Carry Trade in August. Technicals suggested bullish continuation and a significant turbulence around the $6,109 SPX level. Price action reached $6,099 on December 6th, 2024, triggering a pullback that resulted in a -2.5% decline for the month. A January bounce, fueled by the inauguration and market optimism, recovered the December losses, and the market briefly surpassed the $6,109 level by nearly 40 points, reaching an all-time high of $6147 before another sell-off. As of today, February is also showing losses.
Why $6109? This level was significant due to overbought technical conditions across multiple indicators and my experience using annual support and resistance levels. This is pure technical analysis and response to price action. And as a reference of consistency, this edition from 4 months ago was one of the publications mentioning the level:

Last Wednesday, in a special edition featuring 2025 annual S/R levels for several securities, the market update anticipated a potential pullback based on the Volatility Index and highlighted the importance of the $6082 level for the week, noting that a break below it would signal a bearish shift.
An investor's role is to interpret both macro and technical signals when analyzing indices and to be prepared to respond to market cues. In that same Wednesday publication -access here-, I acknowledged the possibility of bullish continuation with a specific target if a pullback didn't materialize immediately, while also outlining the implications of a February pullback, which is now unfolding. This pullback, if continues despite NVDA earnings next week, would set technical formations that historically have anticipated extended turbulence in the market.
As of today, the conviction of the publication of February 1st that anticipated a red month for the SPX -access here- is playing out.
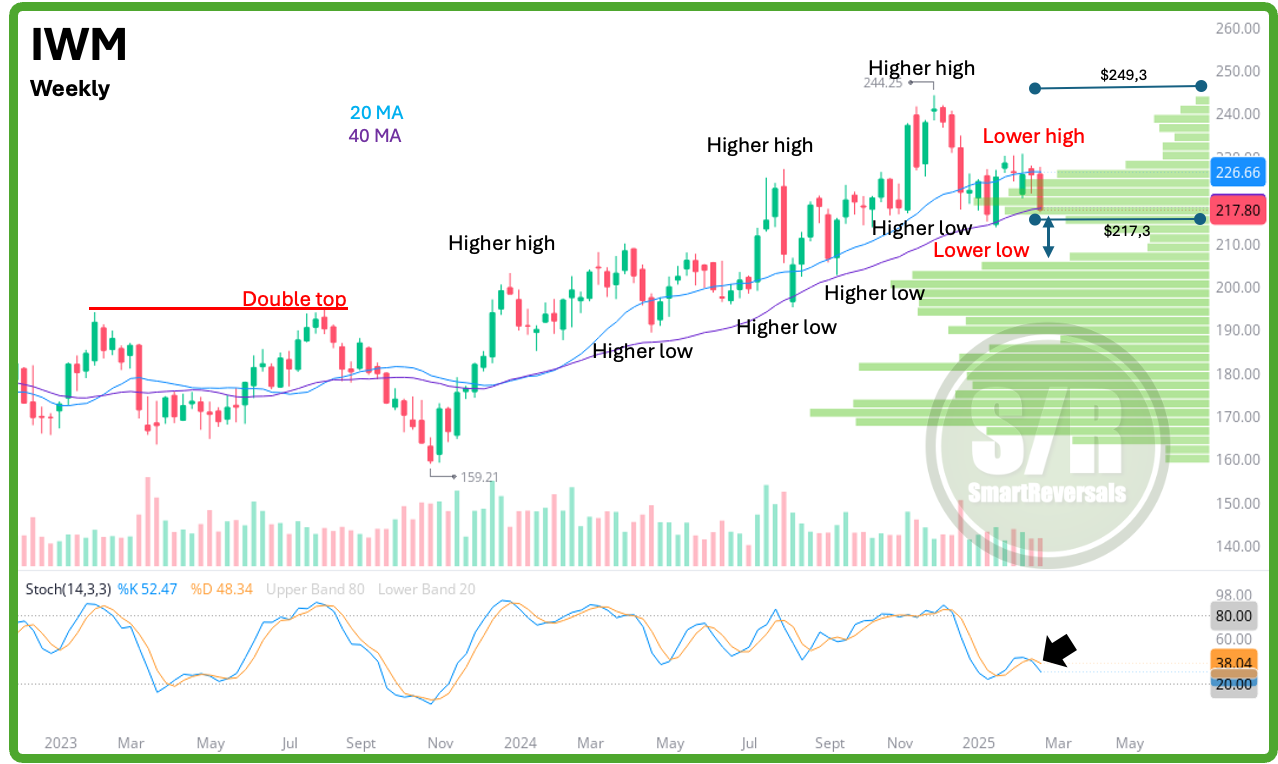
Last week, a bearish setup for IWM was correctly anticipated, with support at $217.3 and providing $225.2 as the invalidation level for the bearish thesis in any remote case of a bounce. Price action crossed $222 with conviction (a support to watch provided as well), reaching $217 with precision and found temporary support.
The small-cap weekly chart reveals a significant shift today, breaking the year-long pattern of higher highs and higher lows. A lower low broke the series finding support at the 40-week moving average in January, followed by a bounce to a lower high in early February. Price action is now testing the critical $217 annual level, which coincides with the 40-week moving average and the lower edge of the volume shelf. This support zone was tested by a bearish candle, which is likely to trigger a temporary bounce next week. However, this bounce must demonstrate conviction and sustain itself throughout the week. Such bearish candles are typically followed by another red candle, or at best, an indecisive one. Furthermore, the stochastic oscillator suggests bearish continuation.
The setup is bearish, and IWM suggests further downside if it remains below $221, with an immediate target of $214.3. Conversely, if IWM recovers and closes above $221 (unlikely), a potential upside target of $224.5 could be considered before a rejection.
The in-depth analysis describing the current setups, with price targets and key annual support and resistance levels continues for SPX, DXY, GLD, SLV, TLT, DJI, NDX, SMH, MSTR, PLTR, GOOG, AAPL, TSLA, NVDA, META, MSFT, AMZN, and BTC; with volatility and breadth indicators analyzed. If you actively trade any of these securities, this publication is essential for making informed investment decisions.
Upgrade now to Premium/Paid subscription for access to a comprehensive library of educational content, covering both technical and fundamental analysis. Learn about technical indicators (oscillators, volume profile, Fibonacci, breadth indicators, and more), fundamental indicators (P/E, PEG ratios, and more), risk management, and trading psychology. If you recently subscribed, you have these resources in the SmartReversals’ site.
You can also get access to a comprehensive library of fundamental analysis for more than 40 top companies listed in the S&P500 or Nasdaq100; including their financial evolution, business context, bullish and bearish factors, and overall price targets view. The library also includes macro editions studying the state of the U.S. Economy, this Wednesday an update will be published.
Let’s continue with the charts and indicators to watch next week. There are notes included with S/R levels for the ES and NQ futures, since big moves could happen in extended market hours.
SPX