


The S&P 500 is sitting at record highs, earnings season just delivered its strongest beat rate since 2021, and artificial intelligence continues to fuel one of the most powerful investment narratives in a generation. On the surface, the bull case has rarely looked cleaner, and that is precisely when careful assessment of context and disciplined risk management matter most.
Macro + fundamental analysis combined with technical charts remain the most effective way to navigate markets. The best recent illustration of why all three matter is Gold; the macro-bullish case was valid and widely endorsed. Yet GC Futures still fell 29% from peak in March to trough by June (5,434 to 3,955). My bullish reversal call came much more precise than macro analysis on July 29th, based on price action, and the reasoning is documented in that day’s publication (link). The same principle applies to Silver, which fell from a January peak near 121 to approximately 55 by July, a -54% collapse that may have looked unthinkable in the first weeks of 2026 when precious metals sentiment was at peak euphoria despite extreme overbought conditions on the charts. Macro conviction without technical discipline can be very expensive.
The same dynamic played out in Micron. On June 25th, the day earnings were reported, the overbought conditions and the gap open acting as a price magnet were flagged in real time. Micron fell roughly 41% from that day through the end of July. That kind of move is painful for anyone positioned without awareness of technical conditions, and the point is not to be right about a single trade but to recognize that ignoring chart structure while following a compelling narrative carries unnecessary risk.
Integrating macro, fundamental, and technical analysis is not optional for serious investors. It is the framework that keeps a third of your capital from disappearing in a trend reversal, or half of it in a commodity crash that the crowd never saw coming.
With that foundation in place, last weekend’s publication covered the strong fundamental strength in corporate America, and my Wednesday’s analysis addressed the six Magnificent Seven members that had reported earnings by that point.
Gain full access by upgrading to the paid plan. Your membership includes three core weekly publications featuring modeled price levels for the week ahead on Fridays, the Weekly Compass with technical actionable trade setups on Saturdays, comprehensive Market Intelligence on Wednesdays, and daily updates on SPX and ES=F. Everything is available at smartreversals.com.
Today’s Agenda
Macro Picture: Corporate Insiders, Valuations, Institutional Positioning, FED, Oil.
Technical Context: Charts for SPX, Indices, ETFs, VIX, Breadth, Gold, and Crypto.
Deep Dive: Charts and price targets for Magnificent Seven and other megacaps.
Momentum Map: Analyzing the stage of every security in a single view.
Setups Blueprint: Entry levels for short and long setups with price targets and invalidation levels for all the securities in the watchlist prioritizing stronger setups.
Let’s begin.
Macro Picture
Corporate insiders sold $77.6 billion worth of stock in the first half of 2026, the second-highest level of selling recorded in more than two decades. For every insider buying shares, eleven were selling. That is not noise. That is the people with the most information about future earnings, margins, and competitive positioning quietly reducing their own exposure at prices they apparently do not find attractive enough to hold.

The earnings picture is real but nuanced. Eighty-six percent of S&P 500 companies beat Q2 estimates, above both the five-year and ten-year averages, and those estimates had already been revised upward heading into reporting season, which makes the beat rate more meaningful than usual. Revenue growth came in near 13%, the strongest since 2022. The caveat is that stripping out one-time valuation gains at two companies (GOOG and AMZN) drops the headline blended EPS growth rate from 47% to 29%. Still strong, but worth understanding what is actually driving the aggregate.

Valuation is where the conversation gets harder. The Shiller CAPE ratio, which smooths earnings over ten years to remove the distortions of any single cycle, currently sits at approximately 40.5. In roughly 150 years of market history, that level has only been exceeded once: in late 1999 at the peak of the dot-com bubble, when it reached 44. The difference today is that the leading companies generating these multiples actually have earnings, free cash flow, and proven business models. The dot-com era was largely built on projections. This one is built on real revenue. That distinction matters, but it does not make 40 times cyclically adjusted earnings cheap.

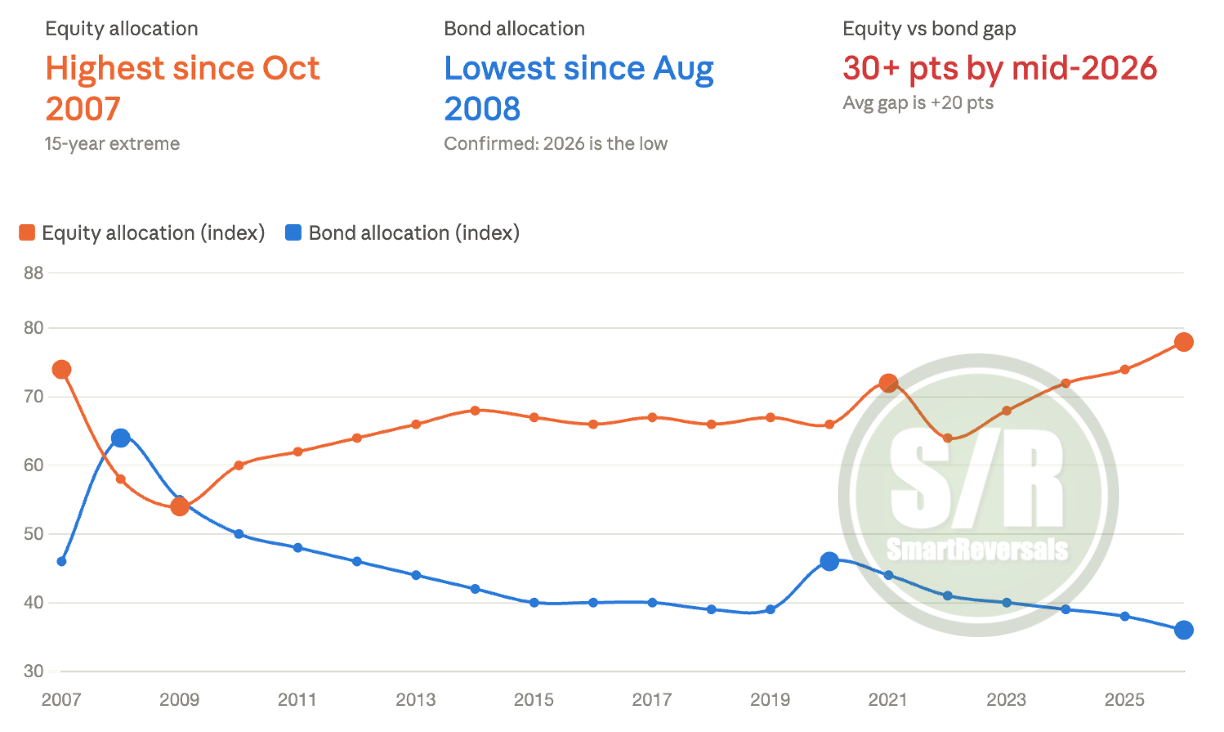
Institutional positioning: Equity allocations among institutional investors reached their highest level since October 2007 earlier this year, while bond allocations fell to their lowest since 2008. The structural over-allocation to equities versus fixed income hit a 15-year extreme. When the largest pools of capital are already maximally committed, the marginal buyer becomes harder to find.
Federal Reserve and Oil: Key Catalysts Poised to Trigger the Next Market Move
The Federal Reserve is the one that most directly echoes the conditions that preceded the last great bubble unwinding, hence the major resistance zones for the SPX: