
Widening Market Cracks: A Harbinger of a Red February
Prudent Investors Should Prepare for Increased Volatility - Examining the Factors Contributing to Market Weakness


This publication flagged underlying market weaknesses last week, and this week's volatility has confirmed the cracks beneath the market’s surface. As an example, let's examine IWM, a highly accurate analysis open during all January editions. Following this, the analyses of the Dow Jones and Semiconductors will be presented.
For IWM (ETF for the Russell 2000), a bearish reversal was anticipated for Small Caps, targeting $226.7. Price action chose the next support level (shared in the previous Friday's edition), bottoming precisely at $224.8 before bouncing to the potential bullish target of $230.4 (also mentioned in the publication). It then reversed again, closing near $226. This reinforces the importance of the support and resistance levels published every Friday for 35 securities. These projected ranges continue to accurately set price action parameters, even amidst recent violent swings.
The chart below displays the support and resistance levels (horizontal lines) for the week of January 27th-31st, as published IN ADVANCE on Friday, January 24th. These levels effectively framed price action, once again, throughout the following week.
Get access here to S/R levels for next week (Feb 3rd-7th) for 35 securities
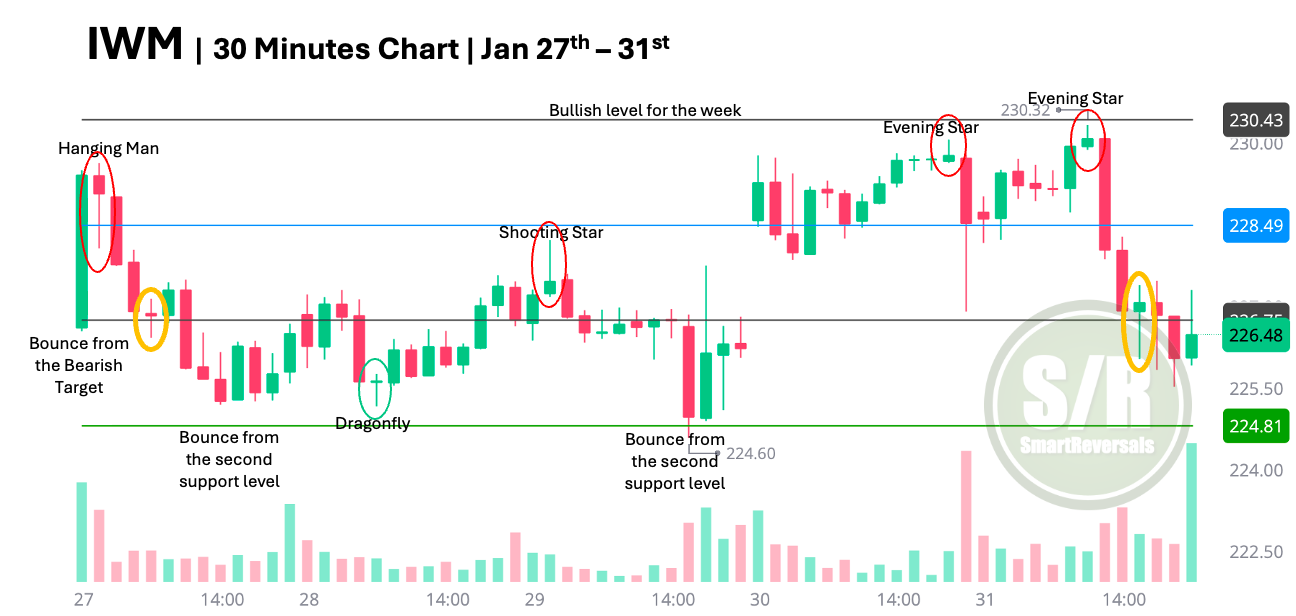
The IWM chart illustrates:
Price action moves among the levels as musical notes are written in the staves
High volatility, nowadays price action is better deciphered in 30 minutes or 1h timeframes than in the usual 2H or 4H charts presented, Violent swings can be observed.
Candlesticks and S/R levels are crucial to anticipate reversals, this is useful for any timeframe trader.
There are more bullish fake signals than bearish ones, opposite to last year, when the bull train fooled many bears.
Click here for educational content about candlesticks
That change of character is affecting the market in general, IWM has been used as an example of the recent volatility that amplifies the moves in price to extended support levels. The updated analysis for IWM is in the premium section, today the charts open for everyone are: SMH (A popular ETF for Semiconductors) and the Dow Jones (DJI).
SMH
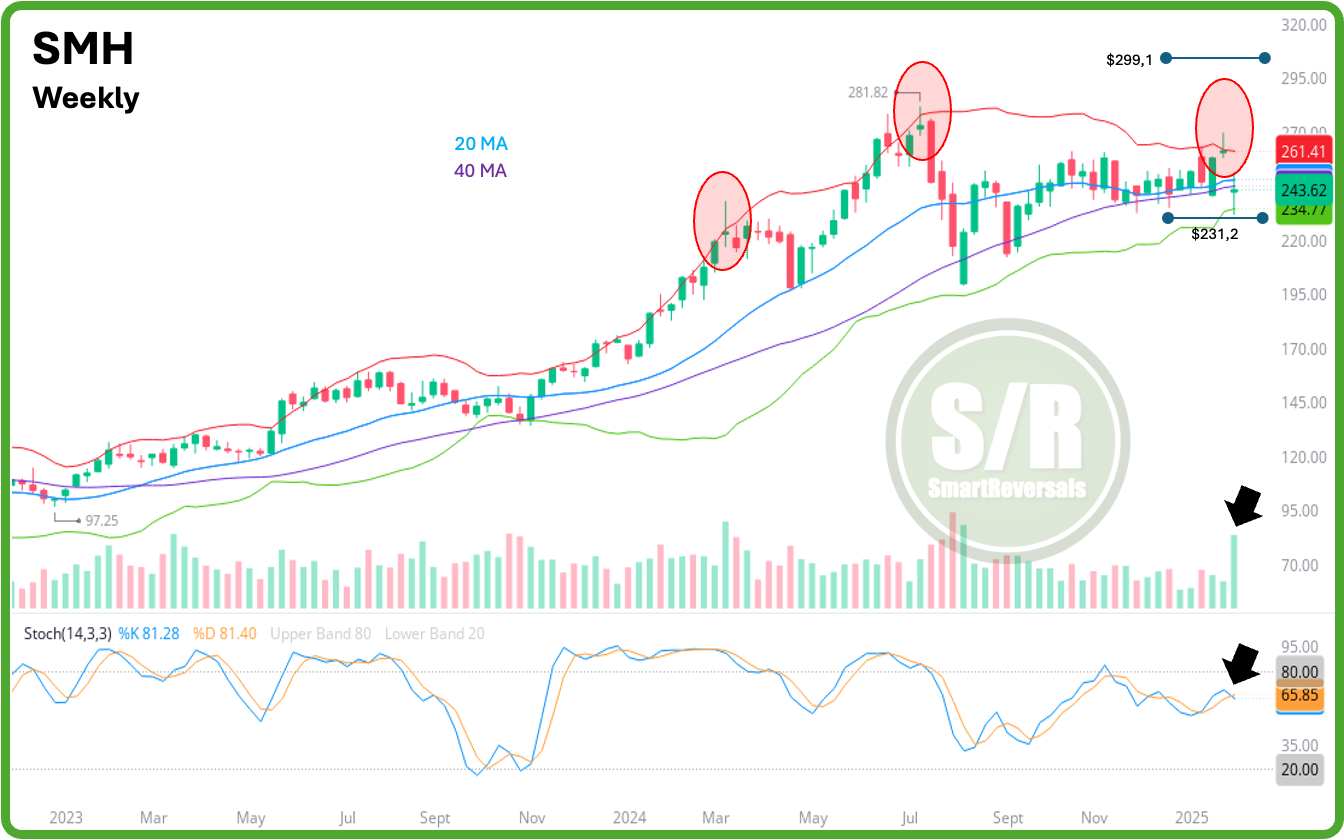
Last week this publication anticipated the bearish setup considering the shooting star candle’s collision with the upper Bollinger band. This proved accurate, with a resulting 6.85% selloff for the week.
Those reversals have sent the price to the lower Bollinger band, and that line was reached already by a long legged candle.
Setup: Immediate bearish continuation is more likely than a bounce, but most of the bearish move may be in, and the annual $231 support proved the relevance of those levels acting as a solid bouncer.
The daily timeframe is bearish considering the latest shooting star rejected from the 20 and 50DMA, so a revisit of the recent low is likely before a bounce considering the bullish gap at $260.8 potentially acting as a magnet.
Bearish continuation if price continues below this key level: $242.4
Immediate target for bearish continuation: $233.4
Potential bullish reversal target if the key level is recovered in a bounce: $252.6
DJI
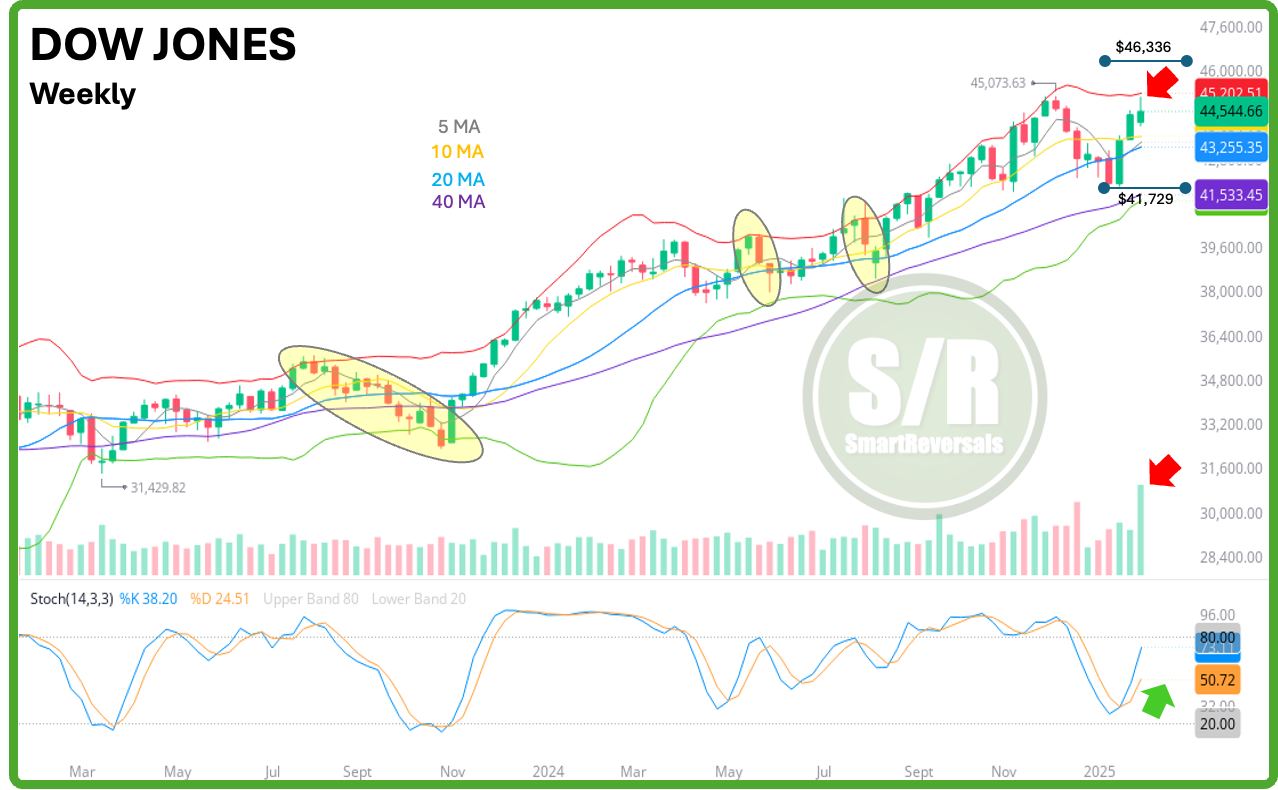
Setup: Consolidation (pullback) ahead
Price action found rejection from the (flat) upper weekly Bollinger band printing a potential reversal candle. Stock participation (breadth) is deteriorating for this index, and the latest daily candle is a bearish engulfing one.
Bullish continuation if the key level continues as support: $44,541.8
Immediate target for bullish continuation: $45,057.3
Potential bearish reversal target if the key level is breached: $44,029.2
The chart highlights visits to the upper Bollinger band when it is in a horizontal position. The godfather of the indices is always worth watching.
This publication covers the following securities every Saturday: SPX NDX DJI IWM SMH TLT NVDA META MSFT AMZN GOOG AAPL TSLA PLTR GLD SLV NAT GAS and BITCOIN. If you trade some of them, this publication is for you.
More securities and indices are studied in Wednesdays and Fridays editions.
Let’s continue.
SPX