

On Thursday, October 1st I documented the technical reasons why a spike in the Volatility Index (VIX) was imminent, commenting in several editions that the move had a 2 week window to occur. On Thursday October, October 8th I anticipated a bearish formation in price action for the NDX, increasing the probabilities for a decline in the market.
This week’s selloff is not unexpected, neither the destinations considering specific price levels that I have been highlighting in the premium / paid content: 7684.7 for SPX / 765.6 for SPY, and 29,647 and 29,235 for NDX / 720 and 711 for QQQ. Those levels were exceeded today, in one of the most bullish month of the year. Remember again: price action is primal, seasonality can be ruled out when technical signals anticipate the opposite move.
For this week, the bearish setups documented last weekend in the Weekly Compass played out: the bearish ones like NVDA, AMD, and QQQ reached bearish modeled targets, while COST, WMT, and NFLX reached their bullish targets (1,000, 116+, and 72.7 respectively) during the week.
Why are these Support and Resistance Levels important?
They identify potential support and resistance zones, assess overall market bias, and anticipate turning points in price action. They represent consensus price levels where institutional volume and market liquidity tend to cluster, they act as critical structural anchors for traders.
The S/R levels remove emotional bias by providing levels where price is statistically likely to react, stall, or reverse. They include a central level, (monthly, weekly, or daily), trading above a central level validates bullish bias, while trading below it signals a defensive or bearish stance.
Central Weekly Level
The S/R levels include a set of seven lines, three resistances, three supports, and one central level that validates bullish conditions when the price is above it, and bearish conditions when the price is below it. It establishes the core equilibrium price for the trading week.
This QQQ chart shows the CWL provided in this publication since March 2026, see the effect of losing this level and how healthy is momentum when the price is above it.
This level is updated every Friday for the week ahead including all the tickers in the watchlist.
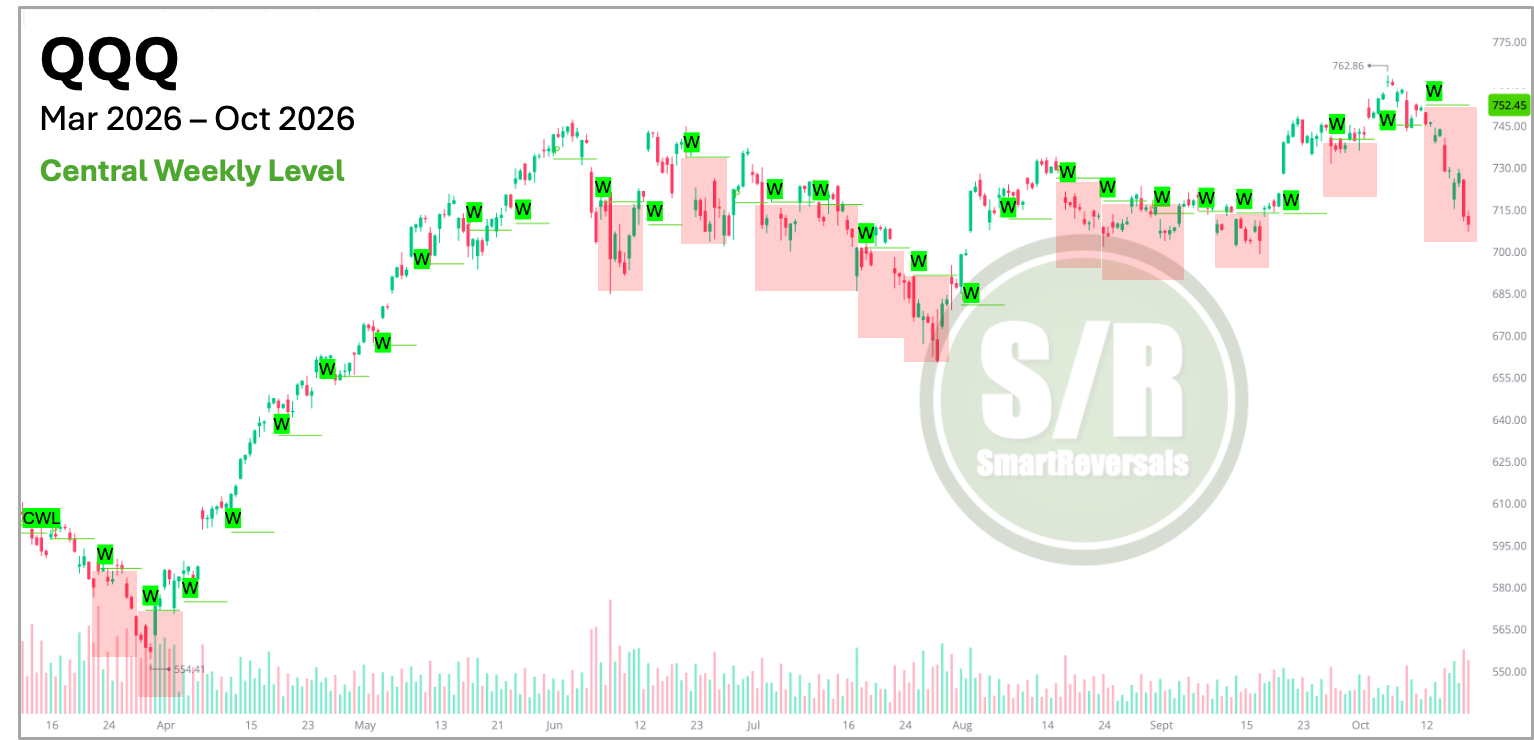
Risk Management Framework: The CWL define invalidation points for bullish setups when it is breached, and it invalidates bearish setups when it is recovered, allowing for precise stop-loss references and objective risk-reward ratios considering the levels above and below the CWL.
Central Monthly Level
It works in the same way but the monthly levels are much wider in general, the principles are the same as the CWL. The CML represents major structural support or resistance. When a market undergoes a sharp correction holding the CML often distinguishes a routine sector rotation from a broader market breakdown.
Institutional algorithms heavily monitor monthly levels to rebalance portfolios, making a sustained breach of the CML a powerful signal of a larger trend change.
The CML posted here each month for the SPX since 2025 makes the case on how relevant is to lose the CML:
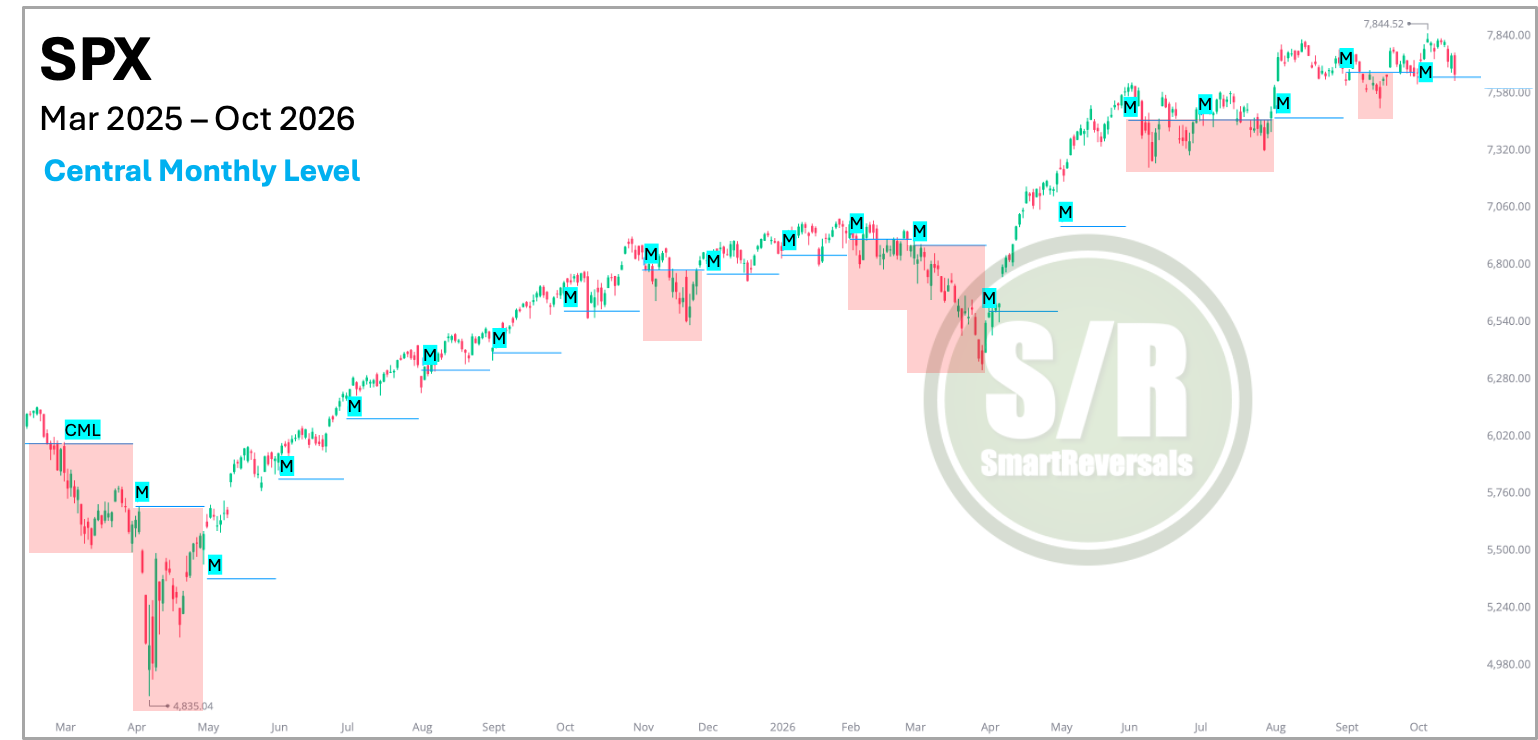
For this reason the support and resistance levels work for traders and long-term investors.
These levels are modeled every Friday for you, providing the information needed to assess risk and reward before the market opens on Monday. You don’t have to wait for the opening bell to decide your plan and which securities to trade; you have here the distances to essential levels and the setups suggesting whether they will act as support or resistance well in advance, so you make informed and serene decisions ahead of Monday morning.
The Weekly and Monthly Levels are posted here for each ticker of this watchlist:
Indices & Futures: SPX, NDX, DJI, IWM, ES=F, NQ=F
ETFs: SPY, QQQ, SMH, TLT, GLD, SLV, DIA, VXX
Major Stocks: AAPL, MSFT, GOOG, AMZN, NVDA, META, TSLA, SPCX, LLY, WMT, AVGO, COST, JPM, XOM, PLTR, NFLX, V, AMD
Crypto & Related: Bitcoin, Ethereum, ETHA, IBIT
Leveraged ETFs: TQQQ, SQQQ, UDOW, SDOW, UPRO, SPXS, URTY, SRTY
If you trade some of these tickers, this publication is for you, and when you are a paid subscriber you can post your preferred tickers in the premium chat every Saturday and your customized weekly levels are returned on Sunday.
Today’s Content:
Weekly Levels for the Watchlist
Monthly Levels for the Watchlist
Combined Levels
Daily Plan for Monday (SPX and ES=F)
Let’s begin.
WEEKLY LEVELS - Will the Selloff Continue?
Tickers marked in red are set to open below next week’s CWL and momentum is bearish, the distance they have to jump to flip momentum from bearish to bullish and provide signals that a bottom can be in is the percentage in each cell. See the difference in tech names versus other tickers: