

The tactical bounce expected for this week faded quickly on Thursday as fears of severe AI regulation took over. Following the midterm results, regulatory concerns surfaced as political figures amplified calls for strict oversight. This is a resurgence of the aggressive rhetoric, now floating the extreme idea of an outright ban on artificial superintelligence and potentially tougher scrutiny of data-center construction.
On Thursday I posted a special edition analyzing three factors: volatility, seasonality and oversold conditions for tech. I wanted to give this community a clear perspective on the current move and on the high probability of a major bullish opportunity forming. Today I will elaborate on those topics.
I have been skeptical of any bounce lately, and indeed the SPX went nowhere for two months closing -0.3% in September and -0.9% in October. For this week an intermediate bounce was expected before bearish continuation.
The bearish resolution this same week, with the VIX closing its unfinished business at 24.4 and the NDX visiting its 40-week average as anticipated last week, marks the key milestones of the expected decline. With those criteria cleared, today I will study how close a bounce can be, using the same methodology I applied in previous corrections, which combines Fibonacci with my preferred technical indicators. That approach proved right in anticipating 4,830.0 as the bottom zone in 2025, and this year it allowed me to call the bullish reversal in the Weekly Compass of March 28th.
Regarding the high-probability setups for this week, MSFT reached 510.5 (-2.2%), SPCX made it to 123.3 (-8.4%), as the bearish setup indicated. For the technical bounce expected, AMZN reached 267.7 (+11.3%), SLV 47.9 (+7.3%), GLD 368.0 (+3.4%), SPX 7,716.5 (+1.8%), QQQ 700.0 (+1.4%), and GOOG made it to 292.2 (+5.0%), as expected. The bearish setup for LLY was triggered on Friday by the loss of 1,375.9, and today I will update the target based on the trigger.
That makes 8 setups reaching their targets out of 9, with the 9th triggered on Friday. Having a clear process helps you outperform the market and prepares you for major moves like Thursday’s, using the support and resistance levels also posted here for capital protection.
My methodology follows a disciplined process: My Investment Framework.
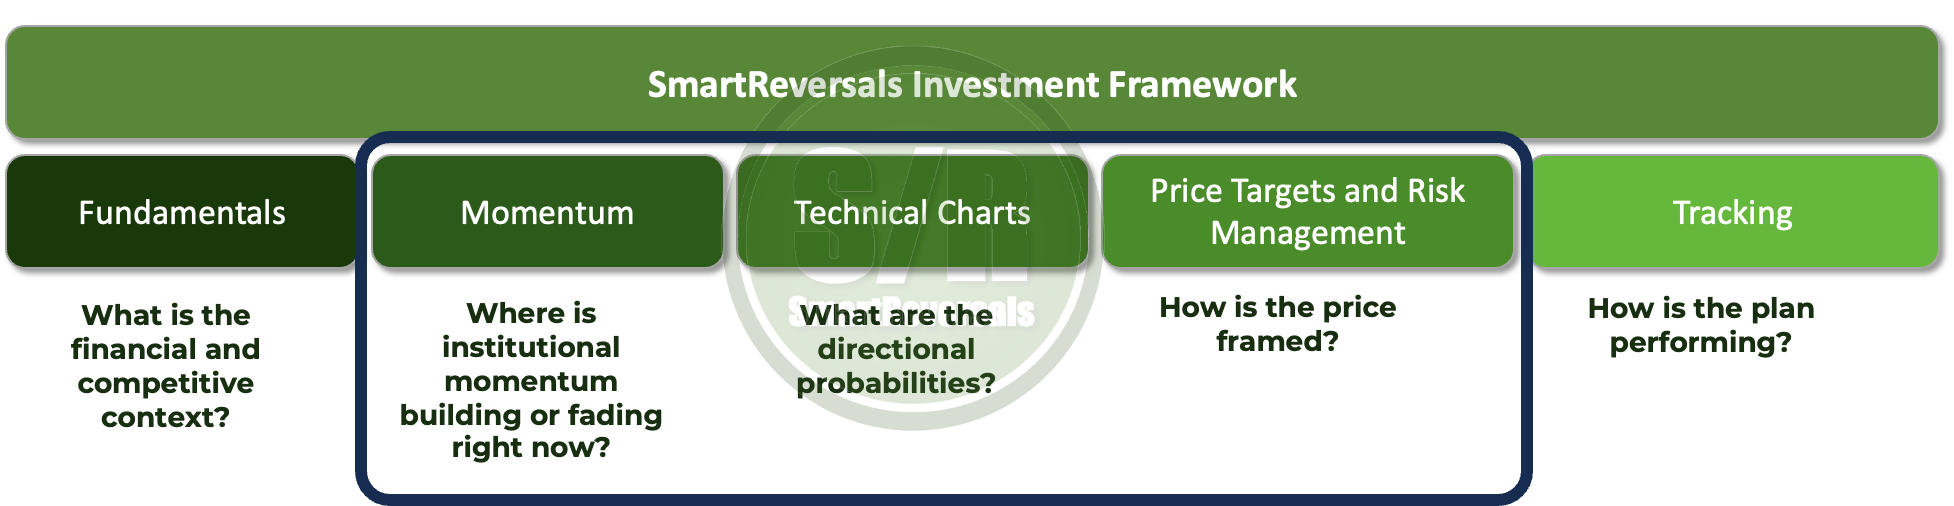
Today we will cover momentum in our stock universe, technical charts, price targets and protection levels for the high-probability setups as highlighted.
Fundamental analysis explains what is behind each chart. The fundamental library has been updated with new reports, straight to the point, with price targets, financial evolution, Economic MOAT, fundamental triggers and more details, in one-pagers available to download here:

During the week, my daily updates track the setups and the stocks that may offer reversals or momentum worth watching.
I apply this approach consistently to our watchlist of mega-caps and high-volume assets, as follows:
Indices & Futures: SPX, NDX, DJI, IWM, ES=F, NQ=F
ETFs: SPY, QQQ, SMH, TLT, GLD, SLV, DIA, VXX
Major Stocks: AAPL, MSFT, GOOG, AMZN, NVDA, META, TSLA, SPCX, LLY, WMT, AVGO, COST, JPM, XOM, PLTR, NFLX, V, AMD
Crypto & Related: Bitcoin, Ethereum, ETHA, IBIT
Leveraged ETFs: TQQQ, SQQQ, UDOW, SDOW, UPRO, SPXS, URTY, SRTY
Unlock this structured and objective approach, with clear, actionable insights, so you can make informed decisions. When you subscribe to the paid plan, you also get access to my educational library with real life charts, and you can post the stocks of your interest so their weekly levels are modeled every Sunday.
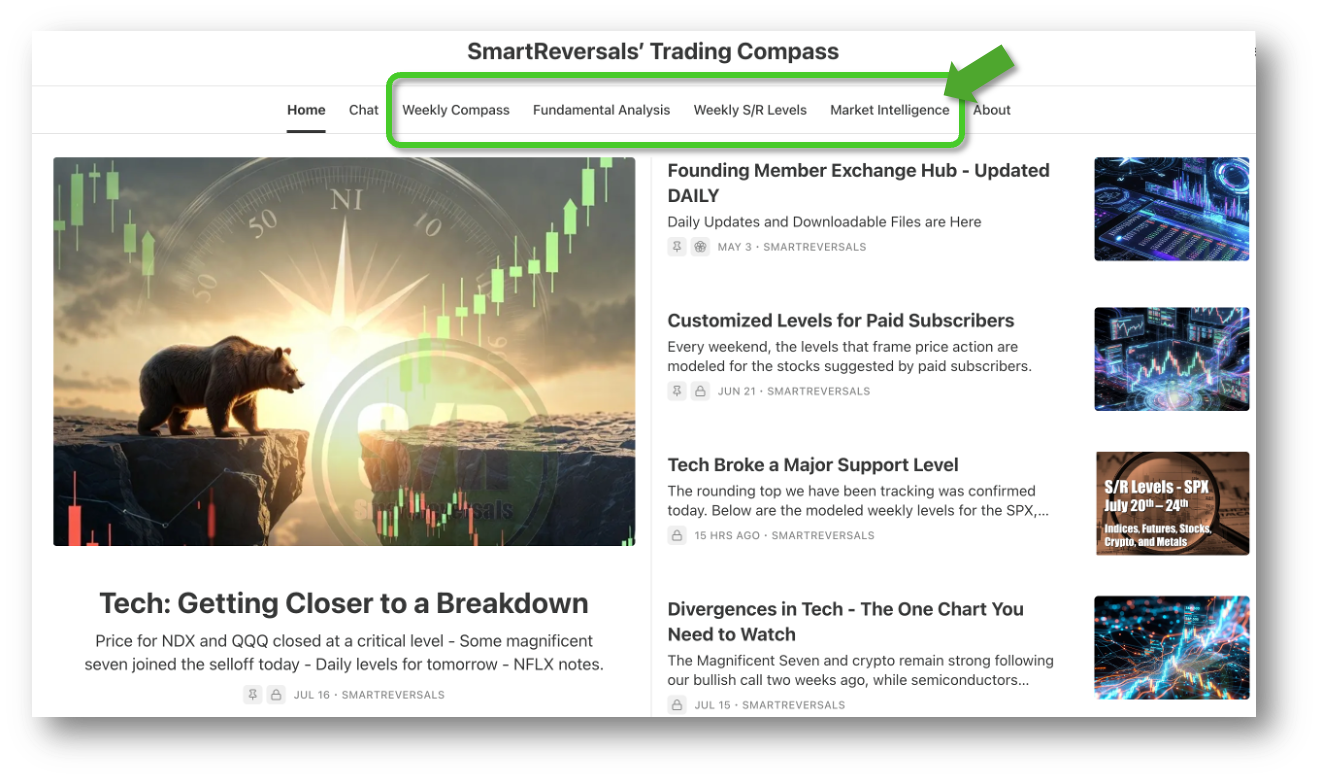
All content is available at SmartReversals.com. Everything is specific and organized.
Today’s Agenda
Market Context: Charts+levels for SPX, Indices, ETFs, VIX, Breadth, and Crypto.
Deep Dive: Individual analysis with charts and targets for Mag Seven and setups.
Momentum Map: Analyzing the stage of every security in a single view.
Setups Blueprint: Entry levels for short and long setups with price targets and invalidation levels for all the securities in the watchlist prioritizing stronger setups.
Let’s begin.