
Anatomy of a Winning Trade: 9 Essential Factors
Navigating High-Probability Setups - Stock Market and Crypto Update


For three months now, the Weekly Compass has consistently delivered high-probability setups. Despite this week’s volatility, several assets have already hit the levels we modeled last weekend: COST (+2.8%), Ethereum (+9.2%), and AVGO, which reached its bounce target of +2.8% before retracing. We also accurately anticipated pullbacks, such as JPM, which is down -6.5% so far. Furthermore, the bullish Bitcoin call sent to paid subscribers on Saturday has already resulted in a +7.6% rally.
Today, we are taking a special approach for the market update by studying the “Anatomy of a Trade.” This deep dive ensures we continue using the actionable insights and high accuracy while prioritizing capital protection through precise stop-loss references.
One single trade can pay for the $49 monthly subscription, or the $499 annual.
The anatomy of a trade refers to the complete structure and components that make up a professional, high-quality trading decision from the idea generation to execution, management, and review.
Professional traders (whether day, swing, or position) treat every trade like a mini-project with clearly defined parts rather than just “seeing something and clicking buy.”
Here are the most common and important elements that typically make up the full anatomy of a high-probability trade/setup:
1. Market Context / Big Picture (The Foundation)
Overall market regime (trending / ranging / volatile / low-vol)
Higher timeframe bias (daily/weekly/monthly trend direction)
Sector / relative strength analysis
Macro/news overlay (rates, economic calendar, sentiment)
Without favorable context, even the prettiest pattern usually fails.
The first logical question to ask today is: What is the current Market Context? You’ll find the answer in this special study, where we defined bullish targets for 2026 using objective criteria for the SPX and NDX. Click here for access:

2. Technical Setup / Pattern / Confluence (The Edge)
The actual visual/chart-based reason to consider the trade.
Common high-quality confluences include:
Structure: Higher highs/lows
Key levels: Previous swing high/low, weekly/monthly S/R
Price action: Engulfing, inside candle, shooting star, doji.
Indicators: Moving Averages, Bollinger Bands, Volume profile, RSI divergence
The more legitimate confluences (3 to 5+), the higher the quality.
3. Trade Thesis / Narrative (The “Why”)
Clear reason why there is an expected directional move. Examples:
Breakout after consolidation, volume shelf acting as a launchpad
Bullish crossovers, price at critical supports and oversold conditions
Reversal setups validated by volume
Mean reversion after extreme RSI divergence in strong uptrend
Bullish / bearish continuation after strong breakup / breakdown breaching key levels
If you can’t explain it clearly, skip the trade.
The second logical question is: What is our thesis for the coming week? What are the Setups? I dive deep into these strategies in the Weekly Compass. Published every Saturday, this report provides the updated roadmap you need for the week ahead. This is the latest one:

Every Weekend the U.S. indices, Megacaps, Crypto, Metals, Volatility and breadth indicators are analyzed making the individual case for our constant watchlist of securities with high market capitalization (TSLA, NVDA, AAPL, JPM, COST, WMT, LLY, SPY, QQQ, BTC, ETH, SLV, GLD and over 20 charts).
4. Precise Entry Trigger (The “When”)
Not just “near the level” a specific confirmation
Common triggers:
Staying above a specific level (CWL or CML in our approach)
Break & close above/below key level (what I call “the trigger”)
Retest + rejection (wick + strong close)
Momentum candle / displacement
Volume surge
Our high-probability setups are built around technical analysis and a specific Central Weekly Level. For a bullish outlook, the price must remain above this level; for a bearish outlook, it must stay below. This level is anticipated every week to effectively frame the upcoming price action and giving you time to prepare your trades while the market is closed.
Let’s study COST. After breaking out from oversold conditions last week, the price action signaled a bullish continuation (as noted in the latest Weekly Compass considering additional indicators) with a target of $950.8 (+2.8%). Since the price held above the $905.8 Central Weekly Level (CWL), the bullish path was clear by Monday morning. Today, a trader might choose to lock in gains at the target or navigate the move by trailing their stop higher. The daily timeframe now reaching overbought levels relative to the Bollinger bands and the Stochastic oscillator suggests some consolidation. Not to mention the precision of our target set before the week started!
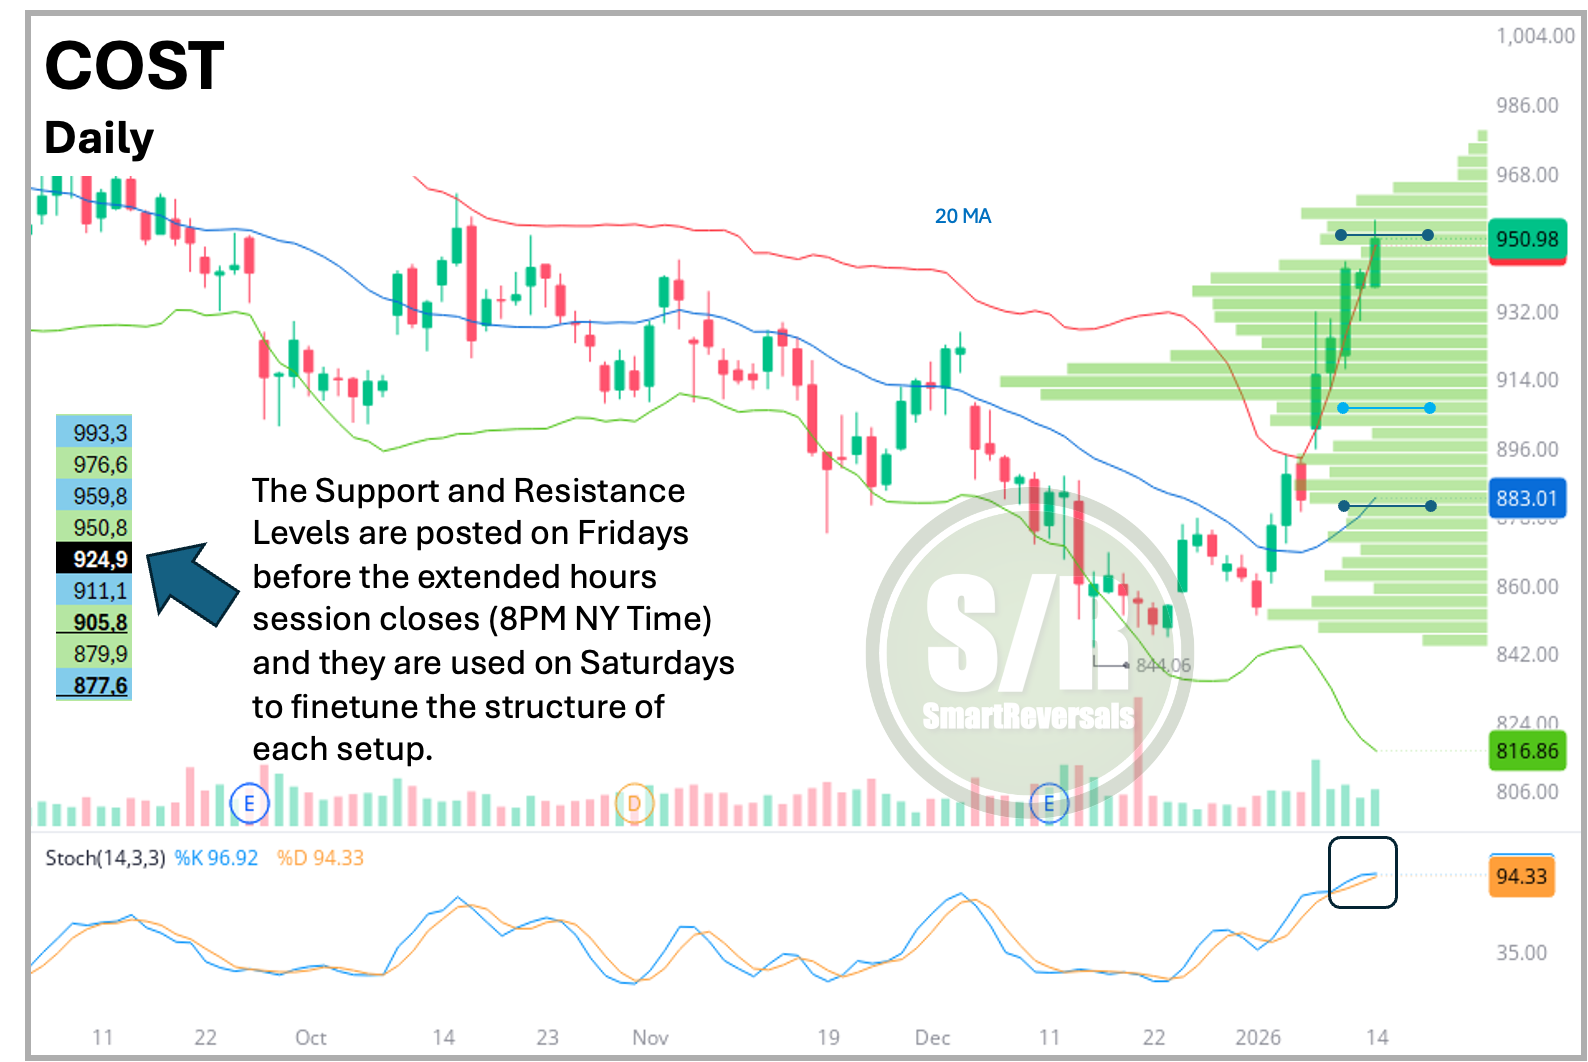
The strength of the Weekly Compass lies in this directional clarity; because every security is assigned a specific bias, setups can often be navigated over multiple weeks, much like our recent run with LLY. Share this with more people!
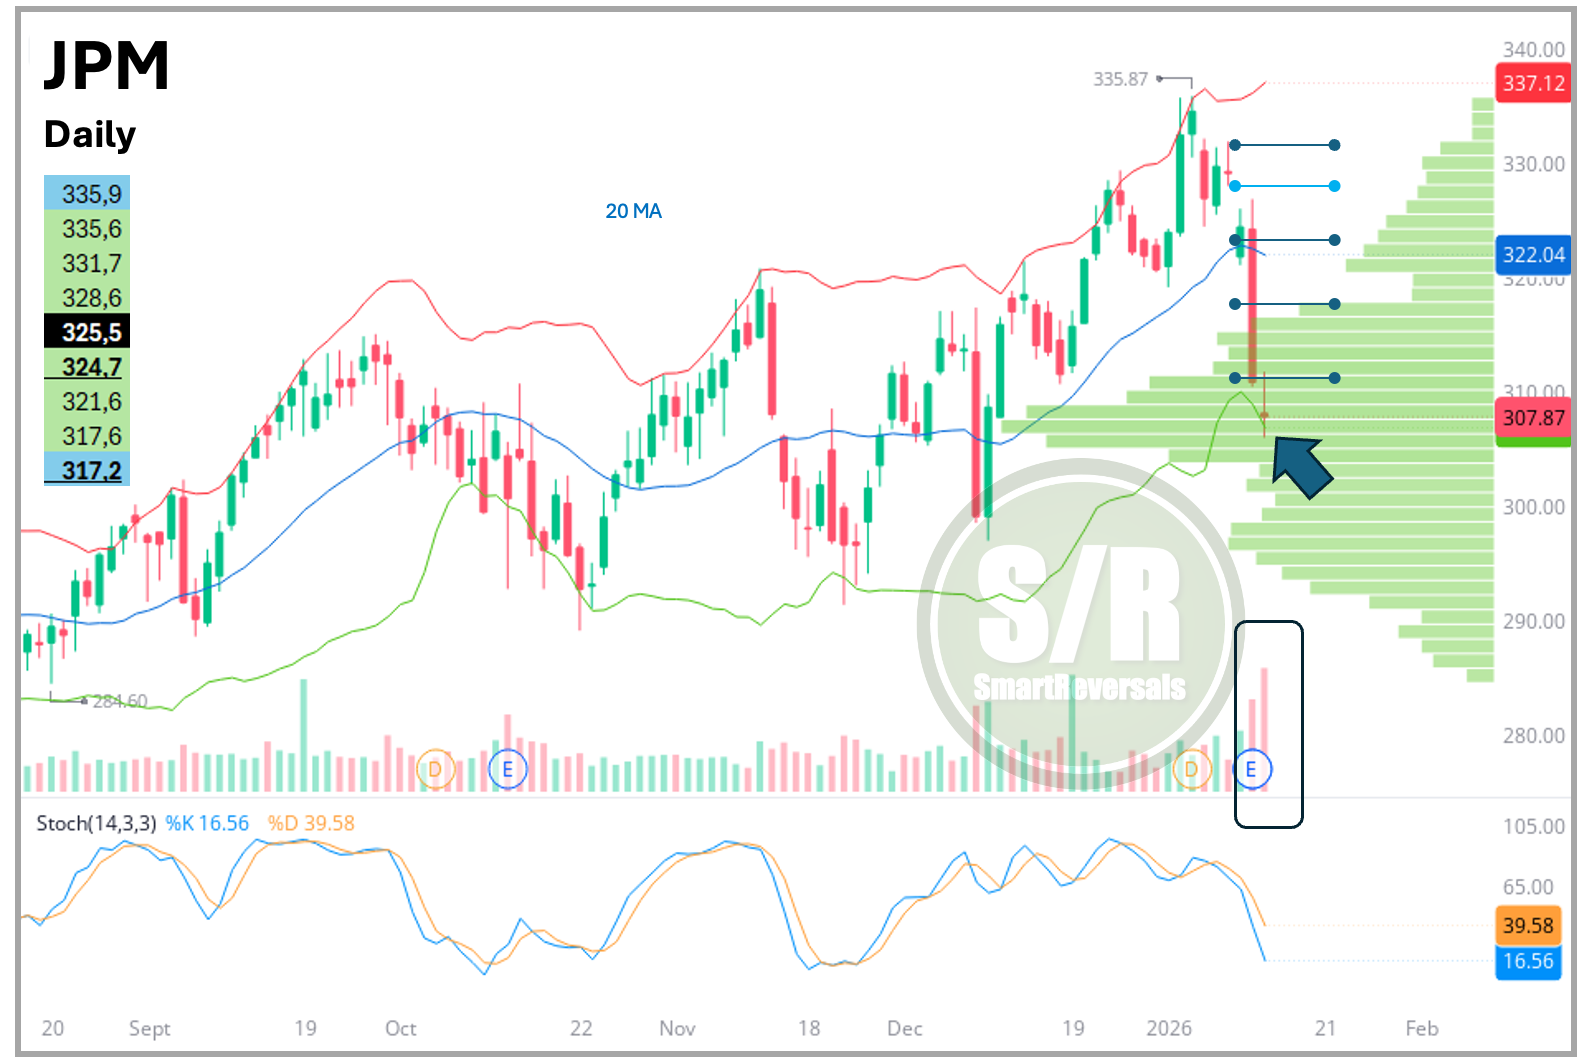
Next, let’s analyze the JPM setup. The Weekly Compass called it as bearish last Saturday. Note the precision of the selloff following Friday’s daily shooting star candle and the subsequent loss of the $324 Central Weekly Level (CWL). Paid subscribers have had access to this level for JPM and 44 other securities since last Friday.
When price opened below the CWL on Monday, it validated a high-conviction short position. (As a reminder: investors can profit from downward moves through shorting just as they do from upward moves through long positions). JPM hit our initial targets of $323, $317.7, and $310.8 in rapid succession. When a level is breached with such conviction, you can navigate the move by trailing your stops lower, using the “support-turned-resistance” levels as a guide. Alternatively, you can lock in gains, which was the optimal strategy for AVGO, a case that provided a warning we will study next. Today JPM has reached oversold levels with an indecisive candle validated by high volume after a fantastic -6.5% weekly move that subscribers could monetize via shorting the stock or via put options. A technical bounce is likely here from the Point of Control of the Volume Shelf.
5. Defined Risk → Stop Loss Location (The Hard Part)
Where the thesis is invalidated
Fixed % risk per trade (0.3–2% of account most common among pros)
We use the CWL as first sign of invalidation when it is breached, and then the CML as a major signal of trend change (for bulls and bears).
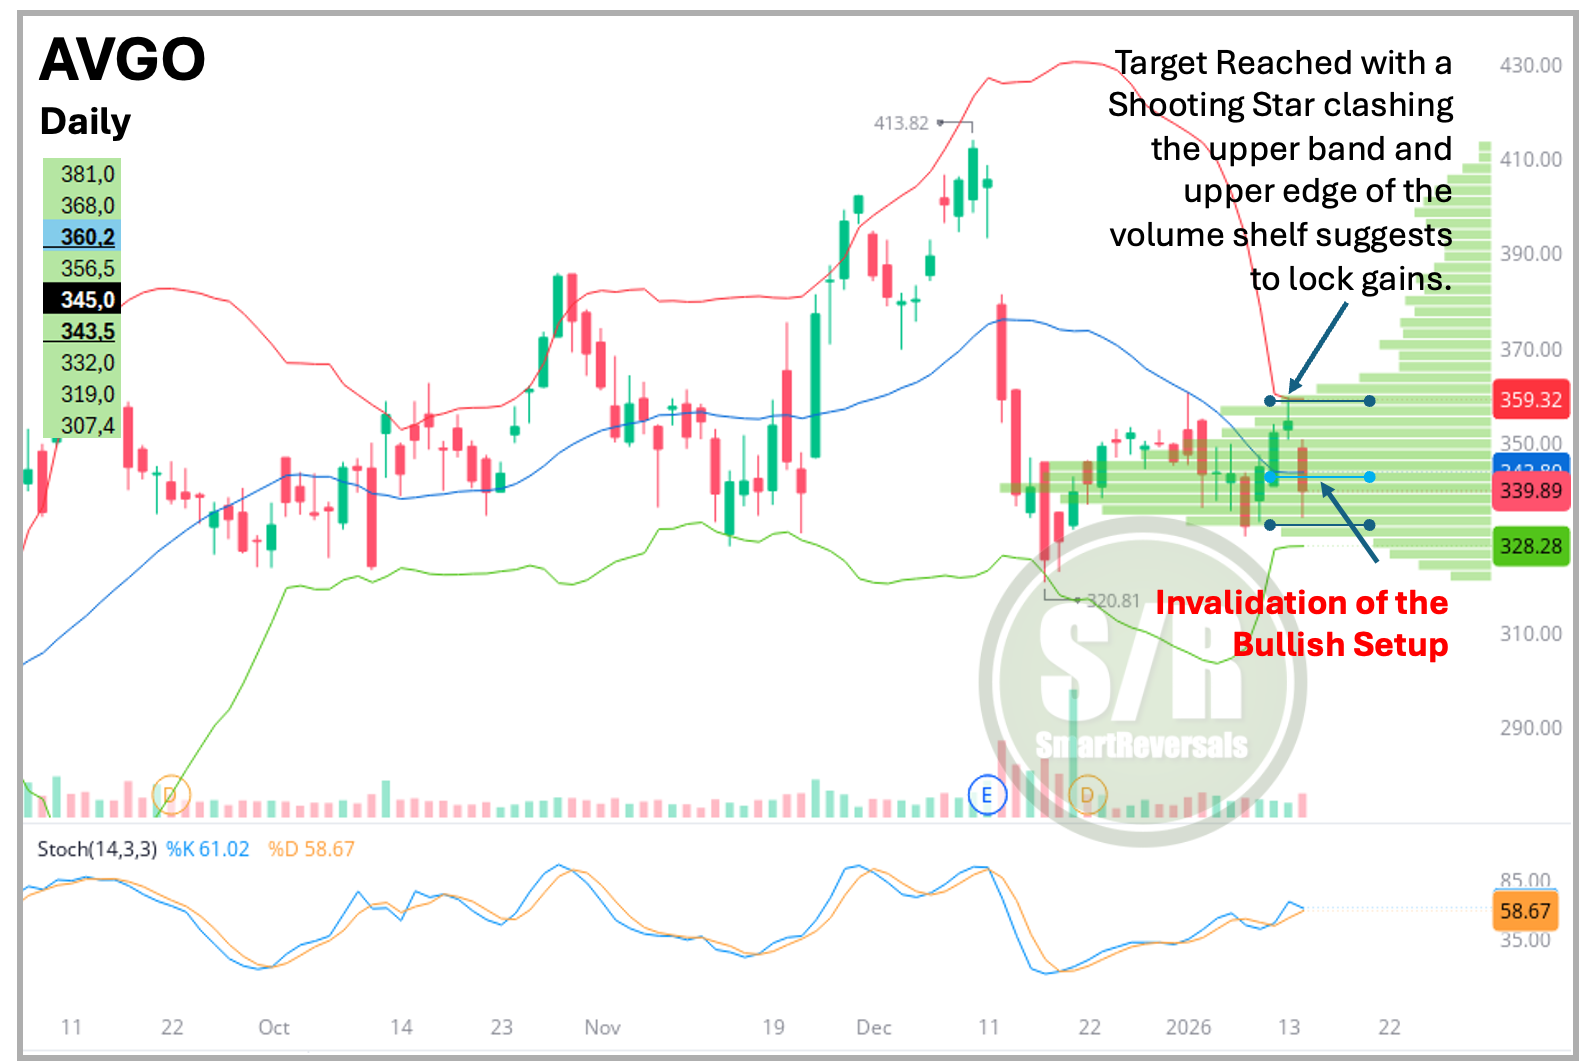
AVGO was another stock with a high probability setup called on Saturday. The CWL of $343.5 was conquered on Monday morning suggesting a clean entry, by Tuesday the target was reached, securing a 3.3% gain. The chart shows a bearish daily shooting star candle that suggested exhaustion and a likely reversal considering the confluence of resistance levels, starting from our target, the upper Bollinger band, and the volume shelf. Locking gains was wise, the recent selloff is not a technical surprise, and considering the breach of $343.5, there is an invalidation of the bullish setup for now, but we made a decent 3.3% gain.
We will continue analyzing the Anatomy of a Trade with setups for TSLA, AAPL, AMD, and the latest Ethereum/Crypto breakout, plus a complete analysis of the SPX based on today’s close.
Upgrade today and unlock high probability setups every week, and receive my exclusive eBook on advanced technical indicators in your welcome email. I’ll walk you through Volume Profile, S/R levels, ROC, and the other tools used in our premium content.
What do you gain subscribing? A definitive technical edge. You’ll receive early access to setups for over 20 securities, each analyzed with a custom-tailored approach. Drawing from 10 years of experience, I select the most effective indicators for each specific chart to provide a clear map of potential gains and enhance your investment decisions. We provide actionable coordinates designed for both active intraday traders and 9-to-5 professionals who need clear, set-and-forget levels for the day ahead. Upgrade now!
6. Reward / Target / Exit Plan (The Payoff)
Multiple targets common (scaling out)
1:2, 1:3, 1:5+ R:R minimum for most pros
You receive different layers of bullish and bearish targets to anticipate potential reversals and to navigate momentum if they’re breached.
They are included in every chart of the Weekly Compass at the left, and provided in advanced every Friday.
You’re reading this as a premium subscriber, every Friday you receive this publication:
They allow to measure moves in advance, of course, the technical analysis is essential to consider the price direction.
They can be used as a trailing method
When NOT to move stop to breakeven too early

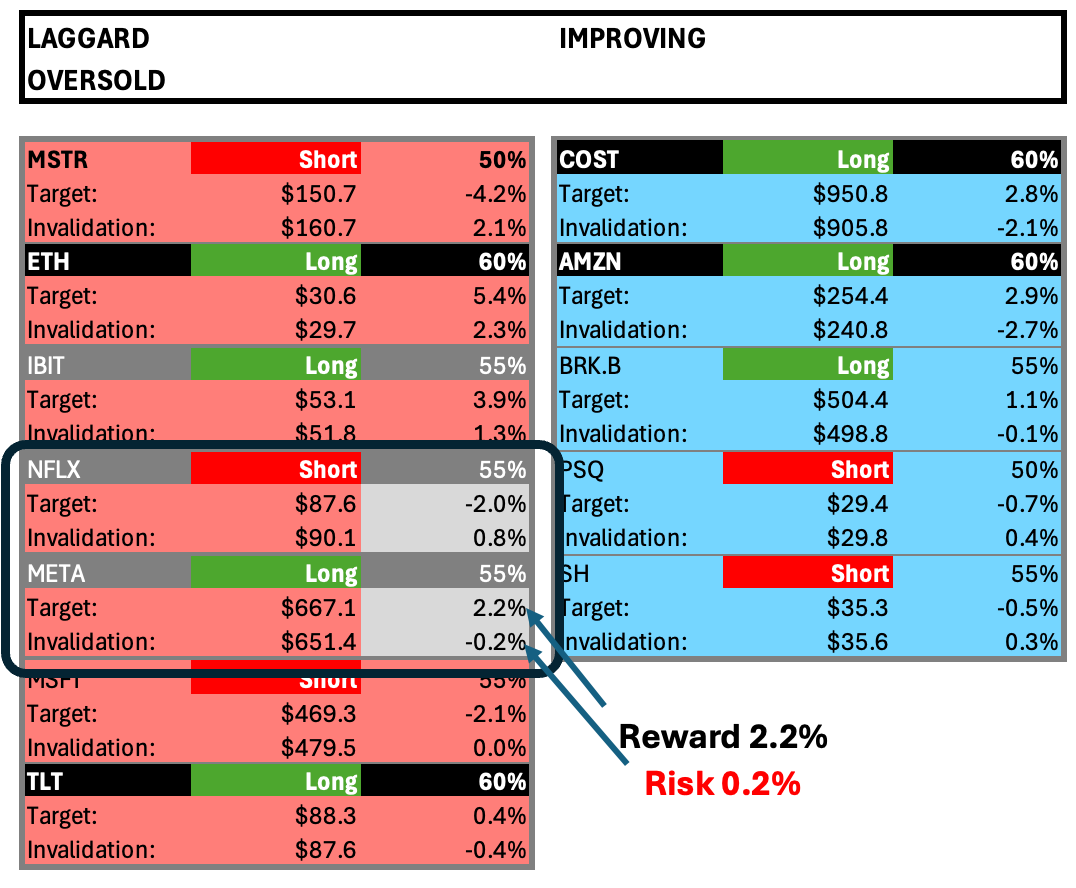
The last set of high probability setups highlighted NFLX and META in grey (also TSLA), my point here is how much can you make versus how much can you lose? The case for META is tight but it’s a good example: The setup is mostly bullish but weak (hence not highlighted in black), a trader can make 2.2% gain considering the next resistance level, while setting a stop slightly below $651.4 (remember, never at the same level; algorithms can visit these levels and bounce).
META went south, so for a person who liked the chart the risk was low versus the reward (essentially it is a 10:1 trade), while COST provided a higher risk (1:1 almost), but I picked it because the chart presented a impulsive move.
Similar case of COST happened with Ethereum and Bitcoin, in those cases the bullish thesis was considered based on the weekly charts indicating a bounce was brewing, and the series of higher lows, which as of now they continue playing out along with the 20 Daily moving average.