

The U.S. stock indexes began the week with an optimistic morning rally, fueled by hopes for geopolitical de-escalation in the Middle East following reports that Iran might pursue a diplomatic path to ease tensions. This early momentum was further bolstered by renewed investor appetite for AI and semiconductor stocks, as the market began to digest the recent “Kimi shock.”
While the initial release of Moonshot AI’s Kimi K3 model last week rattled investors with fears of a “cost-efficient” Chinese competitor, the narrative shifted this morning. Reports that Moonshot AI had to pause new consumer subscriptions due to a lack of sufficient compute capacity served as a potent reminder that, regardless of software efficiency, the physical demand for high-end hardware remains a massive, unyielding bottleneck. This development provided a degree of relief to U.S. chipmakers, suggesting that the “AI race” still requires the very infrastructure that American semiconductor leaders provide.
The Setup Remains Weak
Despite the morning’s initial optimism, the S&P 500 (from +0.5% premarket to -0.2% at the close), Nasdaq 100 (from +1.1% in premarket to +0.04% close), and the Dow Jones (from +0.3% to -0.55%) all lost their central weekly levels within the first 30 minutes of the opening bell, that is a very relevant reference of the lack of conviction in price action. These levels, which I modeled last Friday for this week, are essential for validating potential reversals once breached. You can get them here for the SPX, NDX, DJI, all the magnificent seven, ETFs like QQQ, IWM, SMH, and other megacaps:

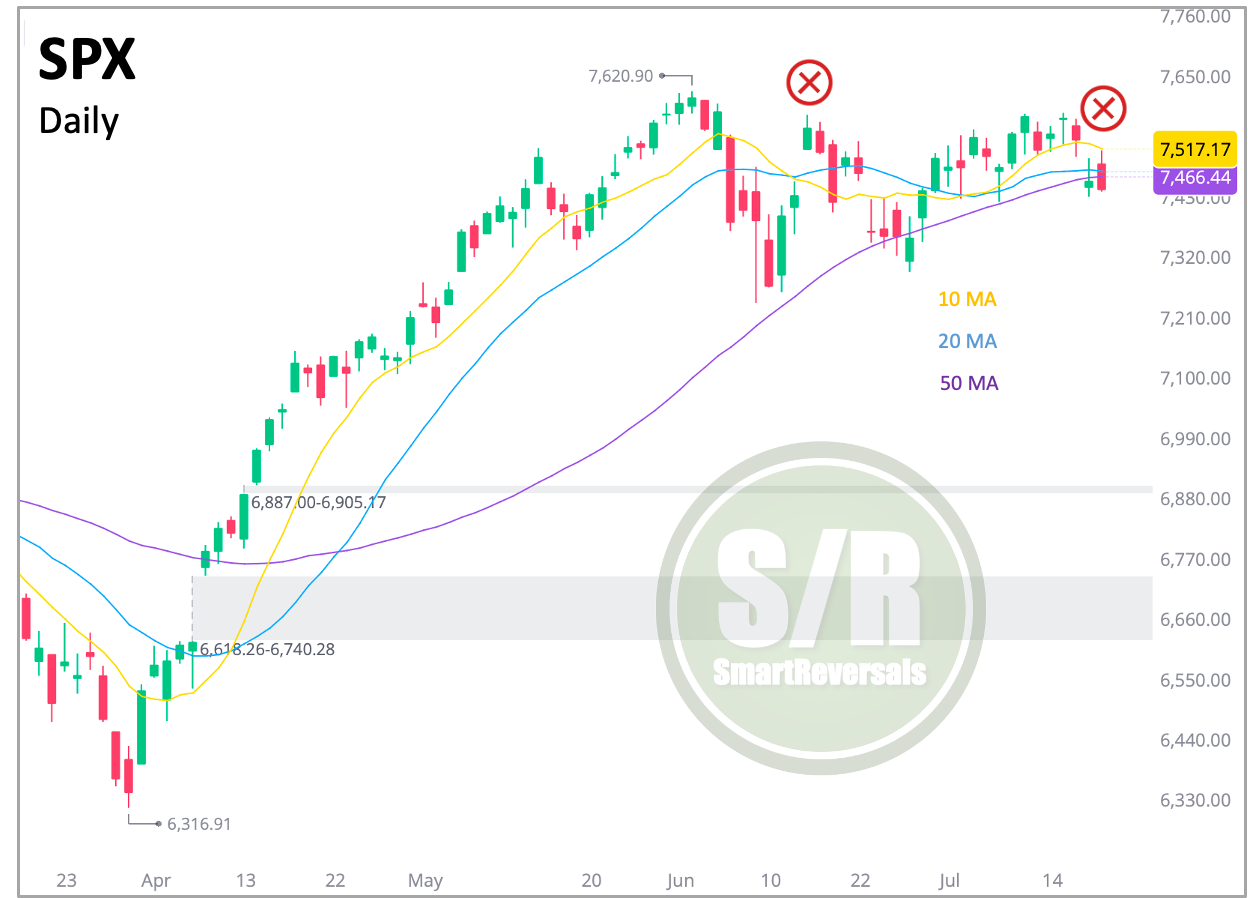
The rejection at the 10-day moving average (DMA) today pushed the price back below the 50 DMA, resulting in a close near the lows. This technical action suggests bearish continuation for tomorrow and shows caution ahead of major earnings this week. (GOOG, TSLA, NOW, and INTC, all tracked via levels in this publication below).
Last week, I shared an educational piece on how to assess reversal risks after premarket rallies or selloffs using the SMH, the semiconductor ETF we track. Today’s price action followed that exact script: a premarket rally that ultimately evaporated. I will now break down that same technical indicator and timeframe for the QQQ, applying the lessons we studied last week to today’s market movement.
It Is Perfectly Human
The impulse to react when watching these premarket moves is totally human. It is perfectly normal to feel that pressure. The most important thing is to remain calm considering the price structure (which is studied here and it’s weak for all the indices) and use our levels for validation in order to avoid traps. While we studied this with the SMH last week, let’s apply the same analysis to the QQQ today, as technology drove the premarket rally that ultimately faded.
In Today’s Paid Content:
QQQ: The setup that helps you avoid market traps: Today’s live case study.
SPX: Daily levels for tomorrow, combined with all key weekly levels.
Deep Dive: Our focus for this week includes GOOG, TSLA, NOW, and INTC ahead of their earnings reports. We will also monitor NVDA and MU given the rapid, shifting dynamics in the semiconductor sector, along with SPCX, as the current selloff may present an opportunity for a bounce. The analysis includes daily levels in combination with weekly and monthly ones to anticipate confluence zones.
Upgrade your subscription and unlock the analysis and levels.