
Double Shooting Star - Pullback in the Making?
Analyzing the Potential Triggers and the Levels to Validate the Bearish Setup

Over the last two months, every dip in the stock market has been bought quickly, leaving many traders waiting for a deeper pullback in the S&P500 and the overall market, that has yet to materialize. Instead, the market has continued to set higher highs and higher lows as the Nasdaq100 and stocks like Microsoft, despite several unfilled gaps below the current prices. This is a market condition I accurately anticipated back in April, when a second bullish signal emerged amidst widespread panic and apathy towards a new bull market. The following quotes are from April 26th when I documented a rare bullish signal with historical charts; for the complete publication, click here.
If this is your first time encountering it, I hope you quickly adjust your market perspective and accept that after such a bearish day like last Monday, the market can roar with potentially reversal candles or gaps invalidating bearish setups.
If you're feeling frustrated about missing the exact bottom and letting doubt prevent you from going long, the three examples charted above might offer some comfort. They illustrate that these types of reversals often occur amidst choppy price action and setups that inspire hesitation. If that resonates with you, it's time to move forward and navigate the market that is in front of us, and not the market we want to have.
A third rare bullish signal then appeared two months later, confirming my analysis. I documented this in two publications which are a must-read for any serious trader. What makes my approach unique is my dedicated study of historical charts to find these repeating, actionable patterns for my readers.
Remember: Charts do not repeat themselves, technical patterns do and those are the insights from my studies combined with the analysis of the current context:
Three Bullish Signals - What Happens Next?
In the historical charts documented for the different bullish signals (including the very first one on April 9th click here), the price rallied rapidly reaching overbought conditions, which is something happening today and a pullback from the current levels is normal.
The shooting star formation is a bearish reversal candle that as studied last week, it has a long upper shadow that is at least twice the length of the real body. This long upper shadow or wick indicates that buyers pushed the price up during the period, but sellers ultimately rejected the higher prices and pushed the price back down. The semiconductors ETF presents a clear example:
SMH The latest weekly candle presents indecision again, this time also with an upper wick or shadow that indicates the selling pressure after a bullish move. Last week this publication anticipated $263 as the bullish target for the week that just ended, and indeed from that zone the price retraced on Friday morning forming the weekly candle mentioned.
Since the oscillator is overbought, and previous similar formations have preceded a pullback caution is key for long positions. One shooting star has been a good warning for a pullback, and two have also provided caution with accuracy as highlighted in the chart. The volume shelf that begins from $231 is expected to act as support zone if a pullback is confirmed.
The use of support and resistance levels helps to validate a potential bearish or bullish setup; the closest levels are in the chart at the top left. The number in black ($257) is the close on Friday, the underlined in green ($259) is the central weekly level for the next week (bullish above, bearish below), which as of today suggests that the price must jump to invalidate the bearish thesis, not the other way around, which adds bearish references for next week.
That said, the current sentiment is determined by the $261 key level. As long as the price stays below it, a bearish continuation is expected with a target of $256.5 which is very close to $255 as monthly level. On the contrary, a decisive move above $261 would signal a potential bullish reversal, targeting $264.8, if that happens next week, $264 must be watched as potential bearish reversal zone as it happened during the week that just ended with $263.

It would be very surprising to see a green candle next week with conviction with the current setup.
Which triggers are on the horizon?
The geopolitical conflict in the middle east and the potential involvement of the United States is something that many market participants are watching, any move that generates fear in the market would be well correlated with the current bearish setup.
On the economic side, a green opening for the week wouldn’t be surprising since there are not major events on Monday, but since Tuesday the FED Chair begins to speak, I personally think that keeping the interest rate as it is is correct, why? because of the special studies that I published in September analyzing rate cuts and the SPX.
You can access here:
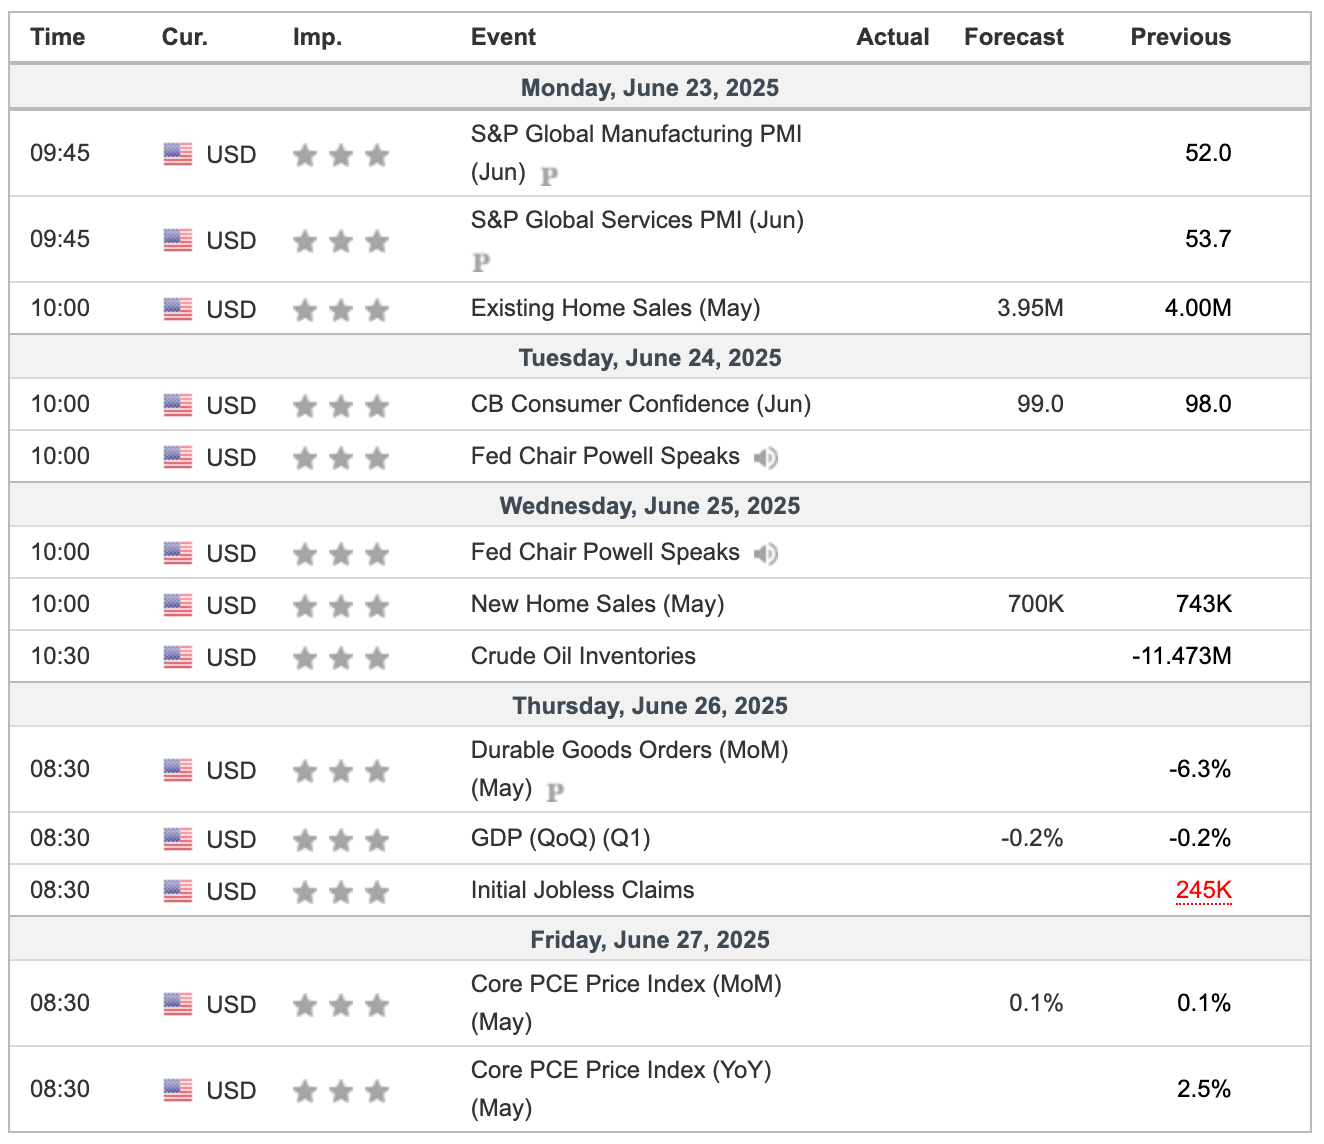
A bearish weekly setup can be materialized until the end of the following week, so let’s also be aware of the Durable Goods Orders, GDP, and Initial Jobless claims on Thursday, and the PCE on Friday.
MAJOR STOCKS
PLTR Has been a front runner in the recent rally, the NVDA for 2025 as I compared in previous publications with NVDA in the first half of 2024. This stock reached $129 as anticipated in April, and then consolidated that zone for a couple of weeks. The price rallied last week towards the weekly bullish target $143 as anticipated with precision in this same publication, and the price retraced immediately. Today, the weekly candle is showing indecision, the RSI is in a divergence mode (higher highs in price and lower highs in the oscillator), and weekly volume is drying.
The central weekly level at $139.4 is critical for validating the bearish thesis. A sustained price below this level indicates bearish continuation, with $134 as the immediate downside target and potentially $130 considering the confluence with the annual level/line in the chart. Conversely, if the market opens the week in the green, helping PLTR reclaiming $139.4 could ignite a bullish continuation towards $142.7 before a consolidation or bearish reversal.

NFLX also reached the anticipated bullish target $1,250, and during the last three weeks the price has been consolidating at that zone. The bearish RSI divergence mentioned for PLTR also exists for Netflix and it’s highlighted in the chart. A consolidation around the $1,250 zone is both normal and healthy. Even though Friday's close was above next week's central weekly level (a bullish first step) it's wise to consider both scenarios just in case. The week ahead is packed with economic news, and the support and resistance levels have proven to be accurate for framing the price action.
This stock's direction depends on the $1,230.7 support level. Holding above this level confirms bullish continuation, with an immediate target of $1,249.2. However, a breach of $1,230.7 would signal a potential bearish reversal towards $1,212.9.
The analysis continues for SPX, NDX, VIX, IWM, DJI, AAPL, GOOG, TSLA, NVDA, META, AMZN, BITCOIN, BRK.B, TLT, GLD, SLV, and stock participation analysis, of you trade some of those securities, this publication is for you.
Last week’s publication presented the charts for GOOG and AAPL open for everyone, the bearish prediction for GOOG was proven accurate, with the price landing in the anticipated level $166. The updated analyses including the assessment of the AAPL bounce are below, upgrade your subscription and unlock all the charts and publications mentioned today.
SPX - How Deep Can the Pullback be? - Can it Invalidate the Bullish Signals?