
Emotion-Proof Trading Edge
Unlocking Disciplined Decisions with a Golden Approach - SPX and TSLA Case Studies

The Support and Resistance levels have once again proven to be a golden tool for traders and investors across the stock market, crypto space, and commodities. The week that just ended provided two excellent case studies, presented below: the Tesla example, where the protection offered by using these levels benefited both investors and traders, and the S&P 500, which serves as a prime example for traders.
Great news for premium subscribers! Last week, I gauged interest in Bitcoin and IBIT, and the votes were evenly split. Understanding the importance of the Bitcoin chart, I will, as usual, chart the cryptocurrency along with its levels and those for IBIT.
Subscribe now – this golden tool alone makes the subscription worthwhile.
Let's begin:
TESLA
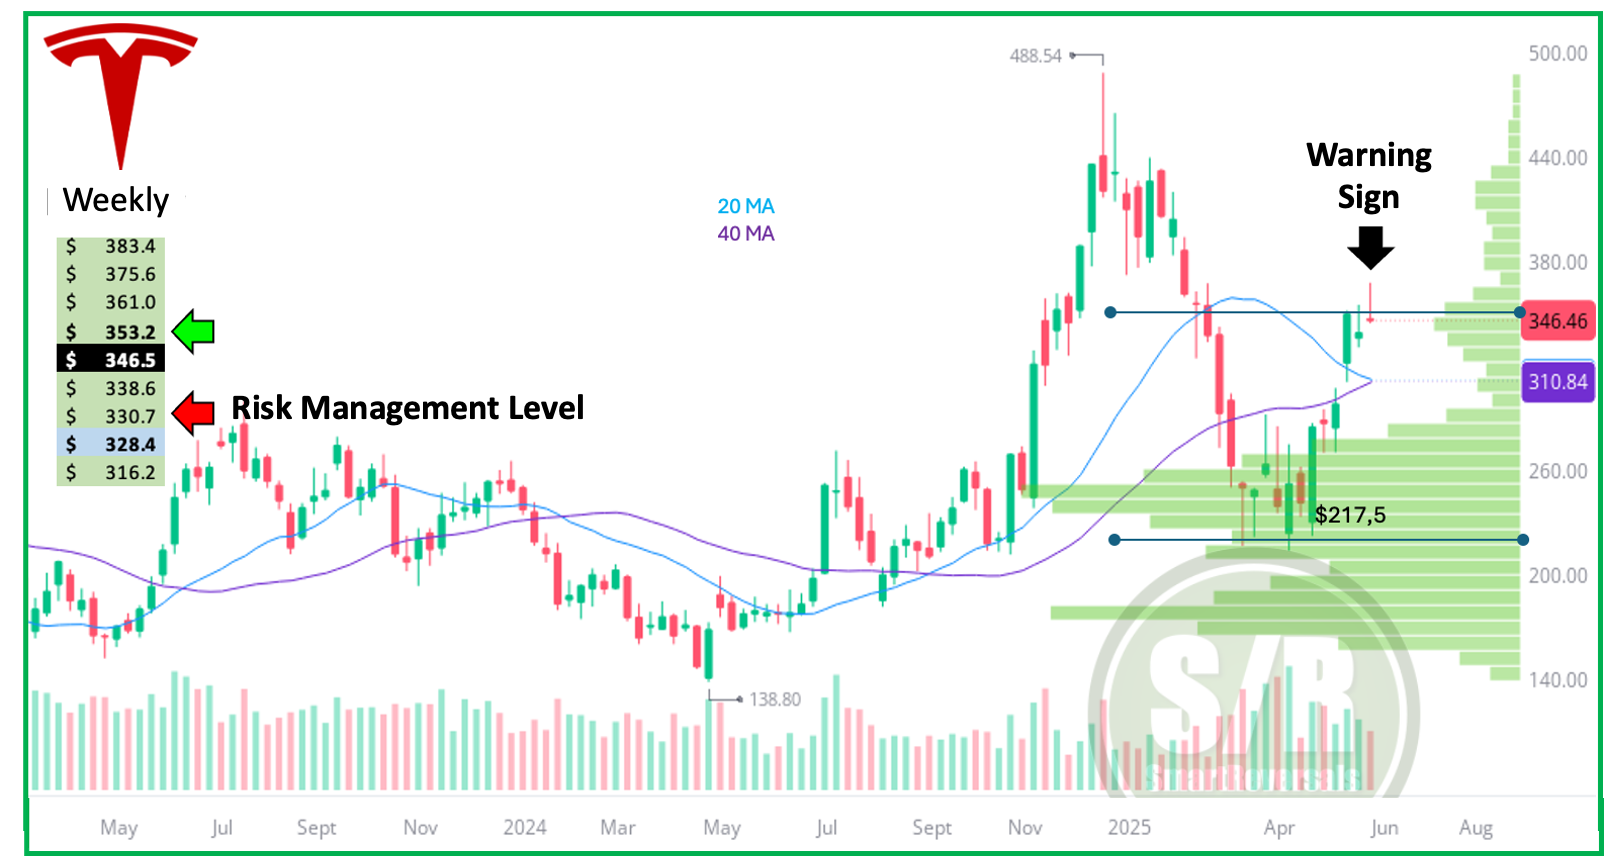
Last week, the Weekly Compass presented the following chart in the premium section for paid subscribers. The shooting star served as a warning sign, finding resistance at a key level detailed in the publication. When such reversal signals caution against long positions, it becomes essential to establish a clear "line in the sand" using support and resistance levels.
The numbers on the left side of the chart indicate the levels published last week for the period that just concluded. These levels anticipated that TSLA needed to recover $353 to consider a bullish continuation and a potential invalidation of the bearish setup (green arrow). Conversely, the $330 zone was highlighted as the minimum downside target. While the willingness to accept a fall from $346 to $330 depends on individual risk tolerance, breaching that zone presented a major warning even for investors. The disciplined application of these levels suggested staying away from this stock until $353.2 was recovered, given a significant underlying signal.
The complete chart can be found in the publication (click here), and it will be updated tomorrow along with the S/R levels and technical analyses for 20 other securities.
S&P500
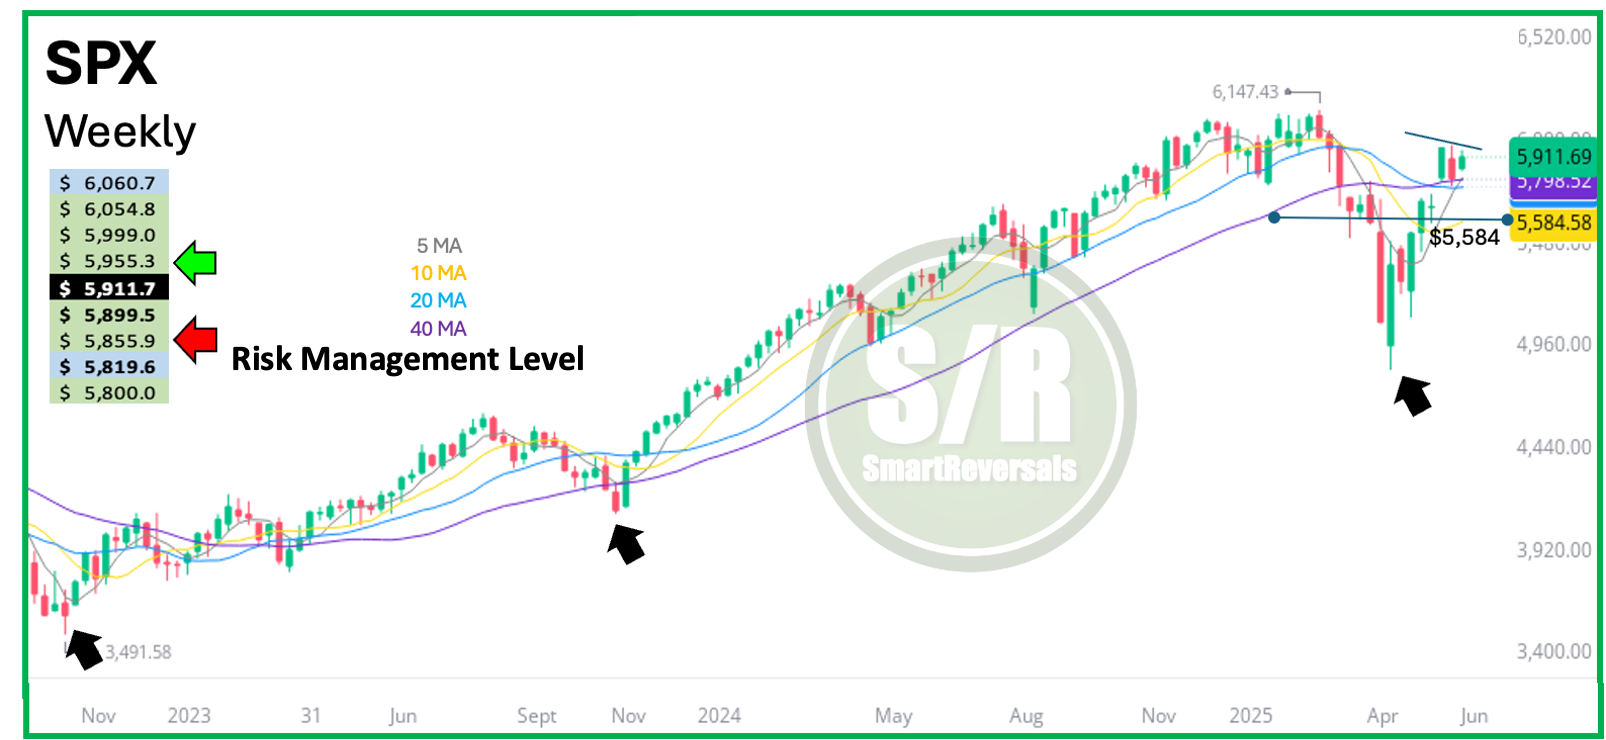
The SPX was analyzed with the following chart (and other indicators), setting some risk for the very short term, and $5,899.5 as the reference to manage risk for longs. This is a good example for traders.
Thursday was crazy for TSLA, the stock crashed, however, nothing happened with the SPX, the central level mentioned for the week that just ended continued in support position and the level helped traders to avoid making premature decisions, actually, the second bullish target or resistance layer, $5,999 was reached with conviction on Friday.
The price moves among these levels as if they were shelves, for that reason they are modeled every Friday for the week ahead.
The complete charts and analyses for TSLA and SPX including the most relevant oscillator and long term targets can be read in the full publication (click here).
The big question today is, What is coming for TSLA?
Trading is about reading the right technical indicators depending on momentum or reversal setups, with those readings that I provide in this publication we assess probabilities, and the support and resistance levels help us to validate thesis that paid subscribers know have a high probability of success.
That said, trading is not about playing the oracle game, the updated setup for TSLA is presented in the premium sections of these publications, let’s begin with the key levels to watch next week, and most importantly, the level that must be recovered to rule out a dead cat bounce thesis.
Below you will find the weekly and monthly support and resistance levels combined for more than 40 securities, if you trade one of them, or some, this publication is essential for you:
SPX NDX DJI ES=F NQ=F SPY QQQ IWM DIA SMH TLT PSQ SH NFLX COST NVDA META MSFT AMZN GOOG AAPL TSLA PLTR AMD MSTR LLY AVGO UNH PFE BRK.B GLD SLV TQQQ SQQQ UPRO SPXS UDOW SDOW URTY SRTY, BITCOIN, and ETHEREUM.
IBIT and ETH, have been added and the combined analysis for all the stocks mentioned.