
Government Reopens but Conditions Suggest Caution
5th Hindenburg Omen Signal - Momentum Map, U.S. Indices, Stocks, Metals, Bitcoin


The week started in the green, precisely as suggested by the technical indicators posted in this publication. The bullish thesis was primarily based on the Volatility Index (VIX) posting a bearish reversal formation (bullish for stocks) on Friday, November 7th. Furthermore, breadth indicators also suggested a bounce. However, considering the long-term price structure for the indices and individual stocks, I maintained that declines do not occur in a straight line, and Monday’s bounce was likely part of a healthy consolidation.
The central weekly level of $6,747 was quickly conquered on Monday and began the week as support. Momentum continued, but the next weekly resistance level of $6,863 rejected the price action starting Tuesday afternoon, the selloff found support near the $6,620 monthly level in confluence with the lower Bollinger band.
Those levels are published every Friday for the week ahead and for over 40 securities including U.S. Indices, Megacaps, Metals, Futures, and Crypto. That publication includes a summary of economic events of the week, you can read it here:

The bounce seen on Friday Nov 14th was logical (though not obvious) given the opening gap down and how oversold the price was relative to the Bollinger Bands in the SPX and NDX. In fact, the NDX found precise support at the lower Bollinger Band, aligning with the $24,649 monthly level. There are chances for a green opening on Monday, but the price has work to do for most of the securities analyzed here.
The pullback cannot be considered complete given the current setups, which we will study today in over 20 individual charts, including: SPX & SPY, NDX & QQQ, DJI & DIA, BITCOIN & IBIT, IWM, SMH, GLD, SLV, PLTR, NFLX, AAPL, GOOG, TSLA, MSFT, AMZN, NVDA, META, BRK.B, and WMT. Remember, the Momentum Map includes other high-level securities like COST, AVGO, and AMD that are mentioned today.
If you trade any of these securities, or if you want to be informed about which assets are in bullish momentum while the broader market is in consolidation or pullback mode, upgrade your subscription to the paid plan. There is always bullish and bearish price action somewhere in the market.
My analysis always utilizes the weekly level that has proven to be a reliable point for making decisions, including the bullish and bearish targets, depending on the price direction analyzed by the technical indicators in this publication.
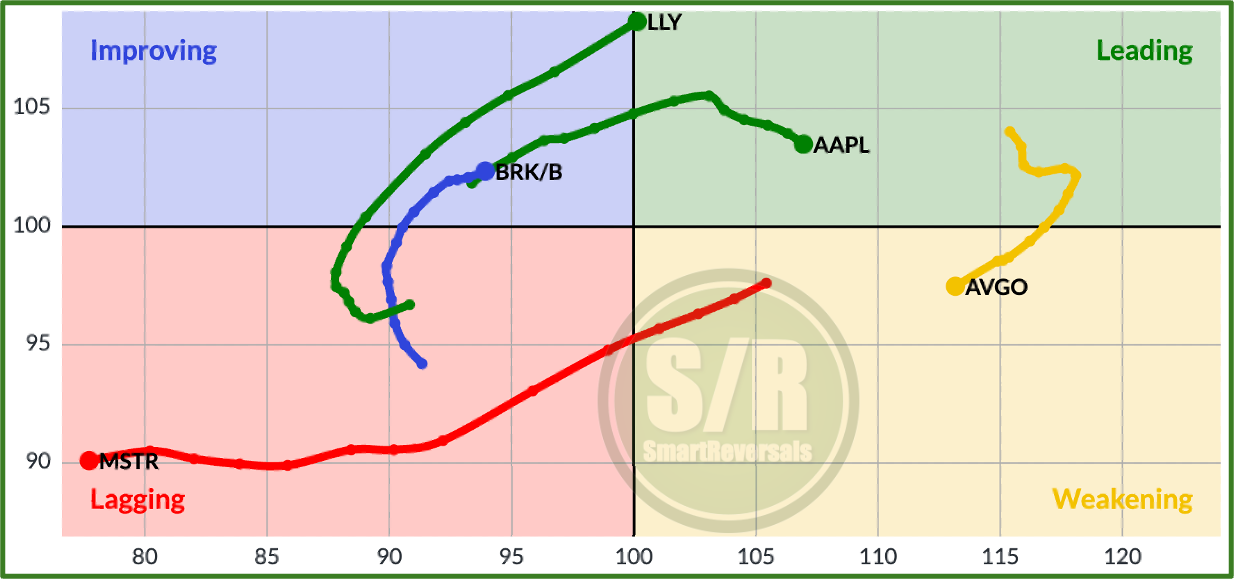
The Momentum Map below illustrates the movement for different companies analyzed every week, the lines present the evolution for over 10 weeks. First, note how Broadcom AVGO fell from the leading quadrant🟢; it is now -11% from its top after a weekly shooting star candlestick and a new bearish MACD crossover. MSTR also continues to decline following a technical setup, and the falling price of Bitcoin is not helping🔴. The red quadrant is where you should avoid long positions, but it is also where solid companies often find support and bounce (I track large or megacaps only). This publication helps to time those bounces using technical analysis, just as it did with AAPL🟢 , today in leading but few months ago in the red one. Since July/August, I highlighted the launchpad this stock was forming as a laggard. The recent rallies in LLY🟢 and Berkshire Hathaway BRK.B🟢 are outstanding; they came directly from the laggard zone. The central level published for BRK.B last week at $481.2 was conquered on Tuesday, Nov 4th, and the +6.5% move is history.
Unlock the Momentum Map with all the securities tracked in this publication, including their technical indicators and key central level to watch, with the bullish levels to watch if breached, and for short ideas the bearish destinations or supports that can be used as targets.
Remember to read the last fundamental+technical deep dives.
Let’s begin with the Momentum Map, the SPX chart and the trading ideas based on the universe of securities mentioned including Crypto, Metals, ETFs, and Megacaps.
MOMENTUM MAP: Securities per Quadrant
🟡 7 coming down from overbought levels and suggesting extreme caution
🔴 7 in the oversold zone, 4 of them are reaching extreme levels with strong fundamentals and oversold indicators that have preceded bounces.
🔵 6 improving, but 5 of them usually overperform during pullbacks
🟢 9 in momentum, some of them very overbought with patterns of a top
Let’s dive into the details and actionable ideas: