
Support and Resistance Levels - How to Take Action
S / R Levels for June 23rd - 27th


Last week's Support and Resistance edition provided a detailed guide on combining monthly and weekly levels. We explored how confluence strengthens these lines and how they serve to validate reversals and momentum.
To fully internalize these concepts, I recommend reviewing that post, whether you're reading it for the first time or revisiting the material.
Today, I will present how to open or closing a position, long or short when using support and resistance levels.
The Core Philosophy: A Top-Down Approach
The foundation of my strategy is a "top-down" analysis. Instead of getting lost in short-term price movements, you start with the big picture and progressively zoom in. This ensures your intraday actions are aligned with the larger, more powerful market trend.
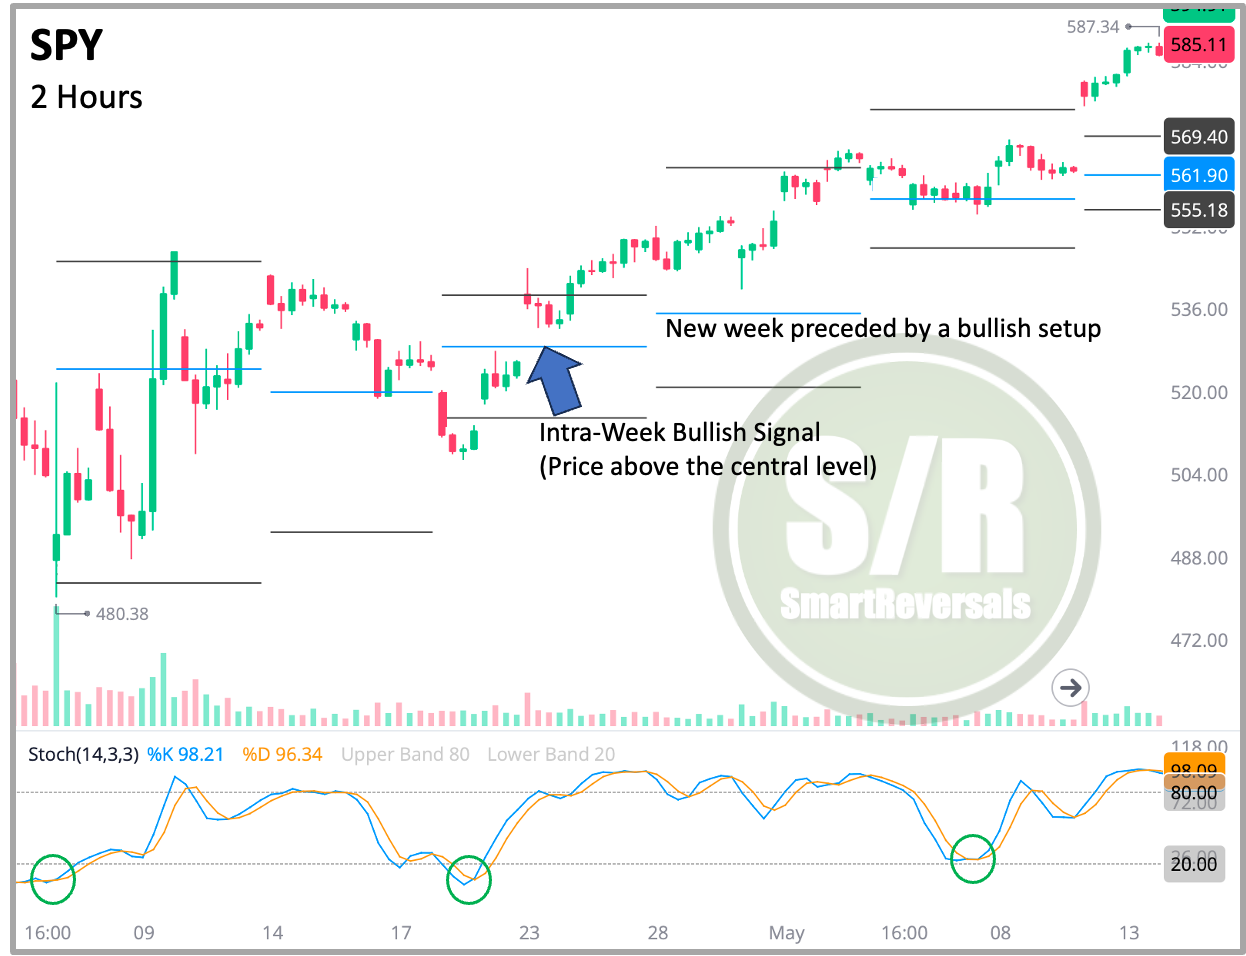
Step 1: The Weekly Chart Sets the Stage Before even looking at a central weekly level, you determine the market's overall sentiment from the weekly candlestick chart. This is your strategic bias for the entire week.
SPX Example: For the week ending April 25th I posted the chart presented below, the SPX didn't just have a random up-week. It formed a bullish reversal setup. This was suggested by:
Price Action: A strong bounce off a low point recovering the central weekly level.
Candlestick: A solid bullish candle suggesting buying pressure and momentum for the week ahead.
Context: The bounce occurred from oversold conditions (as indicated by the bullish crossover in the Stochastic oscillator), adding weight to the reversal signal.

This weekly setup is the reason to even consider a bullish trade. Without it, any buying signal on a shorter timeframe is less reliable for long positions.
Step 2: The Weekly Central Level as Your "Line in the Sand" This line becomes your primary reference for the entire week and the S/R levels published on Fridays calculate how far the price closed from the level of the week ahead, closing above suggests an easier pathway for bulls, it is represented in the red or black numbers in the blue or central column or in the combined levels the figure with black background above the levels underlined and in bold.
Bullish Condition: If the weekly chart analysis is bullish, you want to see the price stay above the central level. This level acts as a dynamic support zone.
Bearish Condition: If the weekly setup is bearish, you would want to see the price stay below the central level, which would then act as resistance.
In the example, the new central weekly level was $5,384 for SPX, and $535 for SPY. The bullish bias from the weekly chart is validated as long as the SPY holds above this $535 level. The pullback on Monday that bounced before reaching it was a sign of strength and a classic confirmation of the level’s importance.
Observe the consistency with oversold oscillators, you can use the same indicators I utilize for the weekly charts, the only difference is that there could be more fake signals, but it is much better to have more tools than trading blindly.
Executing the Trade: Entry Strategies and Patience
With the weekly bias established by the chart and the central level as your guide, you can now look for an entry.
Method 1: The Confident End-of-Week Entry An investor or a swing trader might open a long position around the close on Friday or the open on Monday, based on the strength of the weekly setup alone. The plan is simple: stay in the trade as long as the price remains above the central level ($535 for SPY, or $5,384 for SPX). This approach relies on the power of the weekly signal.
Method 2: The Patient Pullback Entry A trader looking for a better risk-to-reward ratio might wait for a pullback. This is where the use of 4-hour (4H) and 2-hour (2H) charts becomes critical.
The Problem of "Wicks": As you noted, a 15-minute or 30-minute chart can show the price briefly dipping below the central level, which can trigger panic-selling. This is often just market "noise" or stop-loss hunting.
The Solution - Candle-Close Confirmation: By waiting for a completed 2H or 4H candle to close, you get a much more reliable signal. If a 4H candle closes firmly back above the central level after dipping below it, it's a sign of support (always check the overall chart). If it closes decisively below the central level, it's a genuine warning sign that the bullish thesis may be failing.
Managing the Trade: Defense and Offense
Once you are in a trade, your focus shifts to risk management and profit-taking.
1. Setting Your Stop-Loss (The Defensive Play) A confirmed candle close below the central level is one way to exit, being mindful that it can sometimes result in a larger loss. A predefined stop-loss is essential.
The "Buffer Zone": Instead of placing your stop at the central level, you place it a certain percentage below it. This creates a buffer to absorb volatility.
Low Volatility: A 0.5% buffer below the level might be sufficient.
High Volatility (wide level ranges): A 1% buffer gives the trade more room to breathe and respects the current market conditions.
2. Reading Momentum at the Next Level (The Offensive Play) When the price breaks through a resistance level (first, or second) or a support pivot (first, or second), you must assess the quality of the break.
Strong Break (Momentum): A long, solid-bodied candle (like a Belt Hold) breaking through resistance suggests strong buying pressure and the likelihood of continuation.
Weak Break (Indecision/Reversal Warning): If the price breaks the resistance or bullish target mentioned in the Weekly Compass but the candle that follows is a Doji (indecision) or a Shooting Star (reversal signal), it's a yellow flag. This is the market telling you that momentum is fading. However, watching the Bollinger bands and RSI or Stochastic can help you assess if there is just a consolidation because price is not overheated.
Always Confirm with Indicators: No matter the timeframe, check your tools. Did the break of the first resistance occur with the RSI entering overbought territory? Is the price hitting the upper Bollinger Band? These add context to the candle signals.
3. Trailing Your Stop-Loss to Lock in Profits This is the final, crucial step you mentioned. Once the price has successfully broken through a resistance level (e.g., the immediate bullish target for the week) and you've assessed that momentum is strong, you can adjust your exit criteria to protect your gains.
The Adjustment: You can "move up" your stop-loss from its original position (e.g., -1% below the central weekly level) to a new, higher level. A logical new spot would be breakeven or slightly above the central weekly level.
The Logic: By doing this, you have transformed a trade that had risk into one that has zero risk of principal loss. You are now playing with the market's money. Your new goal is to capture further upside toward the next resistance level, while ensuring you give back minimal profit if the trend suddenly reverses. You apply the same risk tolerance (e.g., a 0.5% or 1% buffer) to this new, higher stop-loss level.
Example for Bearish Reversals
This week's market exhaustion presents an interesting scenario where my trading approach can be applied in reverse. To help you navigate this, the central support and resistance levels for next week are posted below.
While I provide levels for over 40 securities, the goal is not to trade them all. Rather, it's to offer a versatile toolkit for your preferred assets. Whether you trade QQQ and SLV, focus on TSLA and Bitcoin, or prefer AVGO and PLTR, these levels are designed for you.
This publication consistently analyzes the following securities to provide a broad market perspective and empower your trading decisions:
Indices & Futures: SPX, NDX, DJI, IWM, ES=F, NQ=F
ETFs: SPY, QQQ, SMH, TLT, GLD, SLV, DIA, SH, PSQ
Major Stocks: AAPL, MSFT, GOOG, AMZN, NVDA, META, TSLA, BRK.B, LLY, UNH, AVGO, COST, PFE, PLTR, NFLX
Crypto & Related: Bitcoin, ETH, IBIT, MSTR
Leveraged ETFs: TQQQ, SQQQ, UDOW, SDOW, UPRO, SPXS, URTY, SRTY
Subscribe now, and unlock all the educational content, the levels for next week, and the Weekly Compass with 20+ charts and price targets. Price action is showing exhaustion, have the right tools to navigate it.
The Top-Down Approach as of Today
For educational content about the technical indicators mentioned in this publication, click on each link according to your interest: Stochastic and RSI oscillators, Candlestick patterns, Moving averages, Bollinger Bands, and Volume at Price. For the complete library, including other indicators like the McClellan oscillator, and studies of reversals and technical patterns in the stock market, click here.

Starting from the weekly setup in order to set an expectation for next week, along with the level that once breached would confirm a bearish reversal, and the respective price targets, the chart indicates the following: