
Hindenburg Omen Triggers with Shooting Stars Across the Board
Market Internals Are Breaking Down as Reversal Patterns Emerge - 5 Indicators to Watch


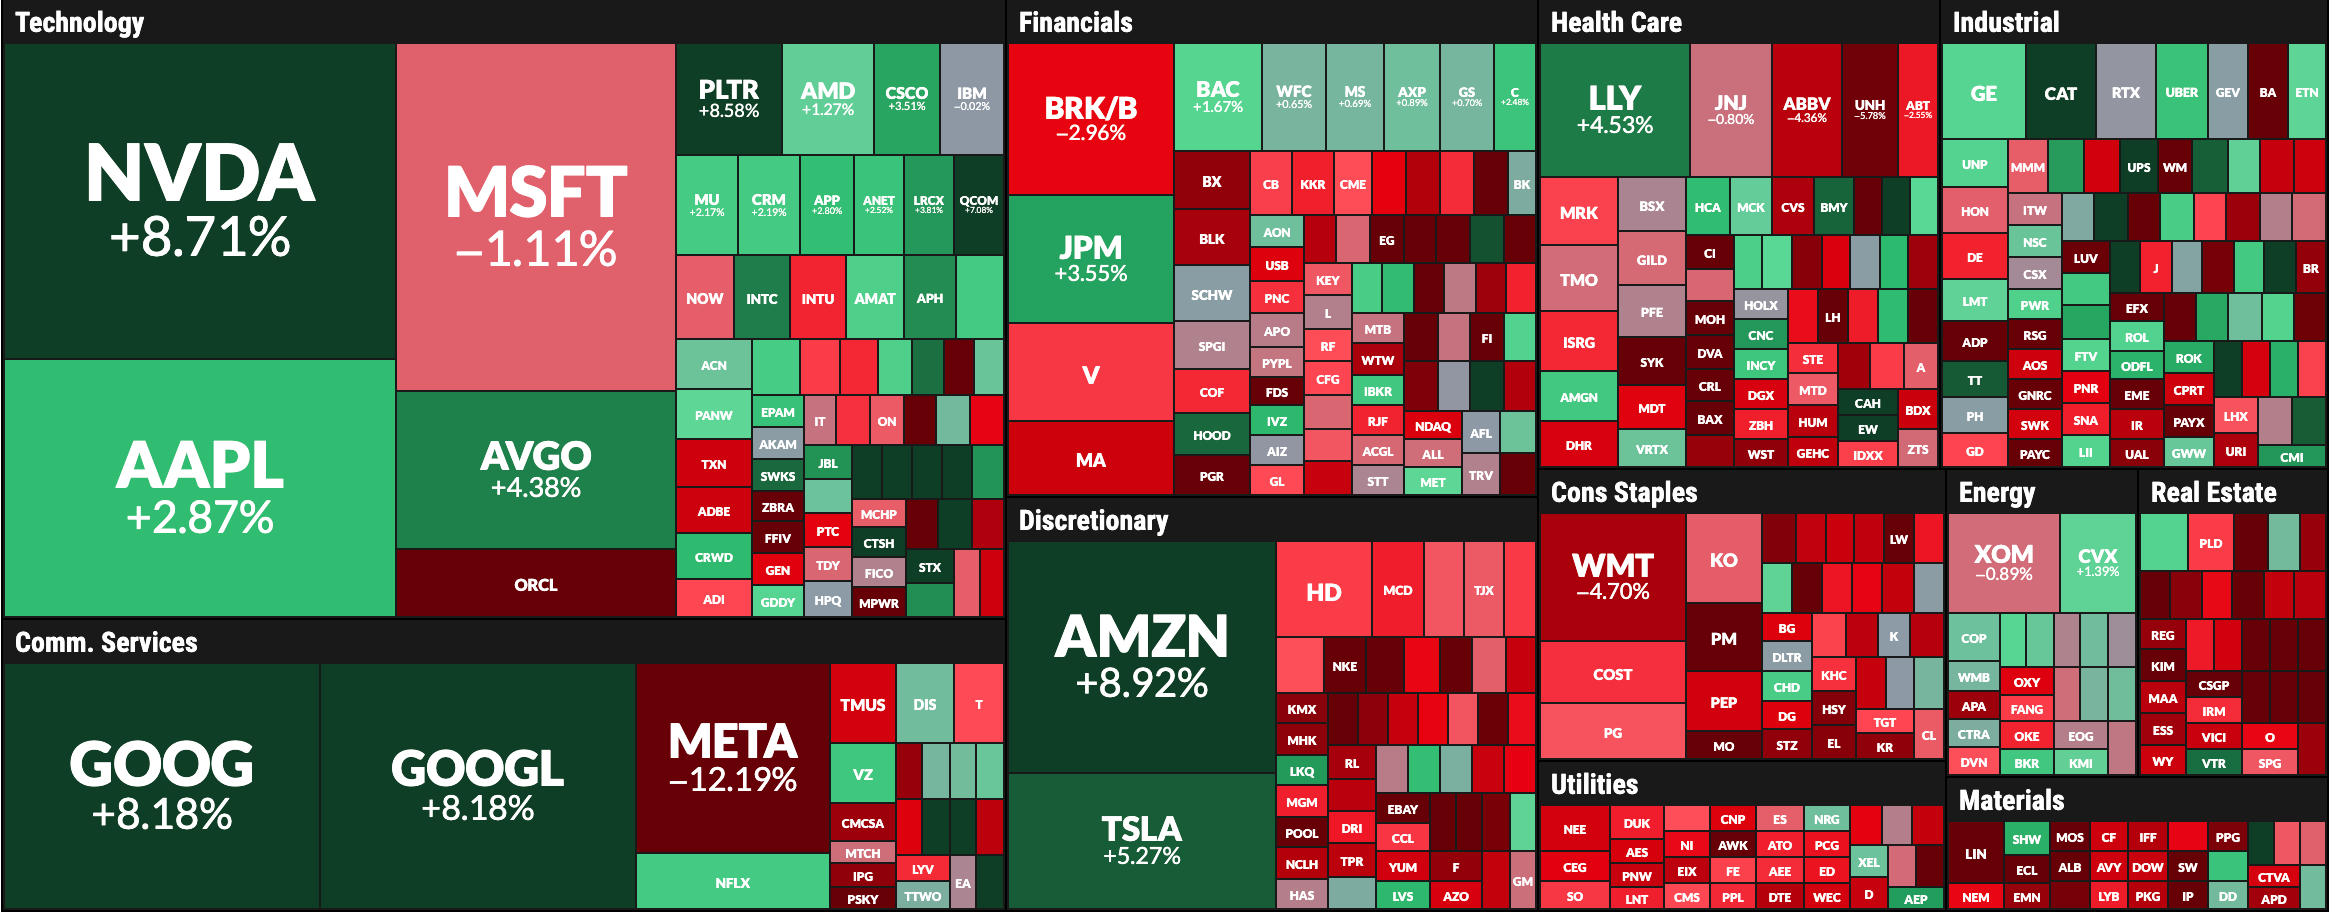
The busiest week of the quarter, and perhaps of the entire year, has concluded. Out of the six mega-cap companies that reported earnings, four beat expectations and saw their stocks rally. The net weekly moves were significant: LLY +4.5%, AAPL +2.9%, AMZN +8.9%, and GOOG +8.2%. Conversely, two stocks failed to hold their ground: MSFT closed -1.1% for the week, and META cratered -12.2%. Overall, from an earnings standpoint, the balance was positive, especially considering NVDA and TSLA also rallied, as shown in the heatmap for the last five trading days:
During the last few weeks, I have been bullish on AAPL and TSLA, and I highlighted the constructive price action showing progress in AMZN. Last week, I also emphasized the good opportunities provided by individual names, such as LLY, which moved into the “improving” quadrant on our momentum map (similar to AMZN and NFLX). NFLX, which I analyzed technically and fundamentally last Wednesday, closed the week up +2.7%. On the bearish side, two weeks ago I highlighted the high chances for a bearish reversal in GLD and SLV; both securities subsequently crashed more than -10% from their highs. Another successful case was PLTR, which printed a solid setup as highlighted last weekend, with the stock soaring +8.6% during the week.
Earnings reports can bring major surprises that override technical setups, which happened with META. Despite reporting a very negative surprise, it is worth noting that Meta took a $16 billion tax hit as a large one-time charge on deferred tax assets. Meanwhile, revenue rose above forecasts, and the company provided an upbeat outlook for the current quarter.
Meta and NFLX offer great tests for those who have been waiting for a market decline so they can buy cheaper. Both companies presented strong revenue growth shadowed by one-time hits driven by taxes in different countries, respectively. We will assess the price action below using technical indicators and key price levels. Anyway, let me ask you: Will you be ready to buy the SPX when it finally falls? Are you considering buying Meta or Netflix, given their strong fundamentals and the 10% discount provided by the tax-related sell-offs? These two companies are a great test, and to be kindly clear, as I receive questions from tens of people every week, this is a reflection for the entire community.
Of course, having the setups is key so that we don’t try to “catch a falling knife.” For that reason, I mentioned last weekend that NFLX was close to a confluence zone of supports, a thesis that is being validated so far.
Below, we will analyze the updated setups, assess how MSFT looks after a week that printed both a rally and a selloff, and review the Momentum Map that is proving its worth by giving us a broad view of the securities we study.
This publication consistently analyzes the following securities to provide a broad market perspective and empower your trading decisions:
Indices & Futures: SPX, NDX, DJI, IWM, ES=F, NQ=F
ETFs: SPY, QQQ, SMH, TLT, GLD, SLV, DIA, SH, PSQ
Major Stocks: AAPL, MSFT, GOOG, AMZN, NVDA, META, TSLA, BRK.B, LLY, WMT, AVGO, COST, JPM, PLTR, NFLX
Crypto & Related: Bitcoin, ETH, IBIT, MSTR
Leveraged ETFs: TQQQ, SQQQ, UDOW, SDOW, UPRO, SPXS, URTY, SRTY
In the paid section of this publication you will find these securities updated in the MOMENTUM MAP exemplified here with the definitions of each quadrant:
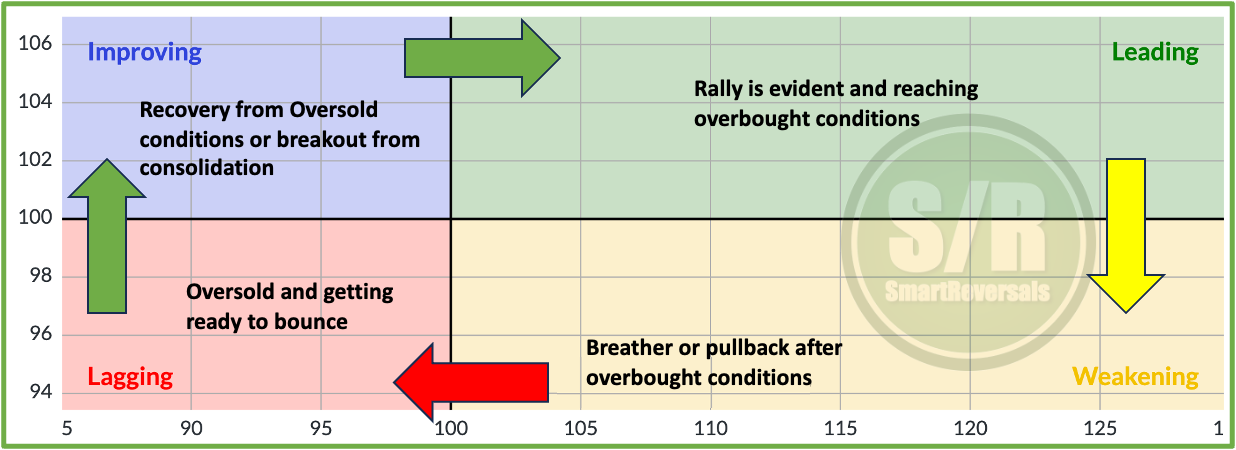
Today I’m presenting the difference between the current momentum map with the momentum map in February, uncovering a significant market condition to consider: Fragmentation, and over 20 technical charts including the securities with their respective price levels including the central one that differentiates bullish and bearish zones.
The latest S/R levels edition was posted yesterday, I write them on Fridays in a concrete edition for the people who makes decisions when the market closes on Friday, and they want to know if the central level for next week (and month like in this case) is going to be above (bearish) or below (bullish) the price close on Friday for each security. (After hours session ends at 8:00PM New York Time on Fridays).
Were you busy celebrating Halloween? Don’t worry, get access to the publication with the levels here:
Also get access to the latest fundamental deep dive for TSLA, NFLX, and INTC; this Wednesday META, MSFT, GOOG, and AMZN will be analyzed with the same approach.
My extended content and deep dives are published on weekends and Wednesdays, but make no mistake: they are strongly linked to the content released in Friday’s publications and those modeled numbers are a key pillar for our Top-Down Trading Method.
Unlock all the premium content mentioned wit all the libraries at SmartReversals.com. There is one additional reason to do it now: a major rare event that I analyze in today’s report was triggered—the Hindenburg Omen.
Let’s continue,
The Fed rate cut occurred this week and the market barely moved, a strong indication that the news was already priced in, proving once again that the stock market operates as a discount mechanism. The Fed’s announcement included uncertainty about further rate cuts later this year, which brought indecision to the S&P 500 and Nasdaq during the announcement, and we will learn how the market digests the news.
The Market Divided: The Hindenburg Omen Triggered
The Hindenburg Omen, a technical indicator designed to measure market breadth, triggered this week. This is a significant event because it signals a deep division and lack of unity within the market.
This breadth phenomenon occurs when the market is “split.” On October 29th, the NYSE saw approximately 476 stocks hitting new 52-week highs while 170 stocks were simultaneously hitting new 52-week lows. For the signal to trigger, both new highs and new lows must be at least 2.8% of the total issues traded.
This divergence is the core issue. A healthy, sustainable uptrend is characterized by broad participation, pulling most stocks higher together. When you see a significant number of stocks at both 52-week extremes at the same time, it tells you the market is not unified. It suggests that a concentrated group of mega-cap names is likely driving the headline index higher, while the broader, “average” stock is struggling or even declining.
The Specific Conditions for a Trigger
For a Hindenburg Omen to be officially triggered, three conditions must be met:
The S&P 500 must be above its 50-day moving average.
Both new 52-week highs and new 52-week lows must be greater than 2.8% of NYSE issues.
The McClellan Oscillator must be negative.
All three of these conditions were met on Oct 29th. The negative McClellan Oscillator is particularly important, as it confirms that, on a momentum basis, declining stocks are outpacing advancing stocks. When you combine this deteriorating momentum with the split in breadth, it strongly suggests the market is internally weakening, even as the index itself holds up.
What are the Implications?
Let’s study historical implications and most importantly, the current market conditions including not only weekly charts as usual, but the most insightful monthly charts with the key numbers we must track in November.
It’s worth noting that my annual target of $25,835 for NDX was reached, and a weekly shooting star was printed at that level, we will study the relevant pattern when an annual level is reached, and as mentioned, two momentum maps, one for February 14 2025, and the one for October 31st 2025. Unlock all the content with the paid plan.