


Macroeconomic data drove the S&P 500 to a brand-new historical high this week, though macro exhaustion caused a slight market decline by Friday:
Inflation Data Sparks a Rally Earlier in the week, the July Consumer Price Index (CPI) and Producer Price Index (PPI) figures boosted equity markets. The wholesale inflation reading (PPI) remained unchanged month-over-month, boosting optimism that the Federal Reserve will pause interest rate adjustments at its September policy meeting. This data originally catalyzed a rally on Thursday, pushing the S&P 500 to a record close near 7,800.
Late-Week Pullback: A Slowing US Consumer The initial rate-pause optimism was tempered on Friday by economic data indicating that the primary engine of the US economy is cooling. July retail sales unexpectedly fell 0.6%, missing expectations of a slight increase. Concurrently, the University of Michigan consumer sentiment index registered a disappointing decline, signaling that macroeconomic pressures are causing consumers to dial back spending.
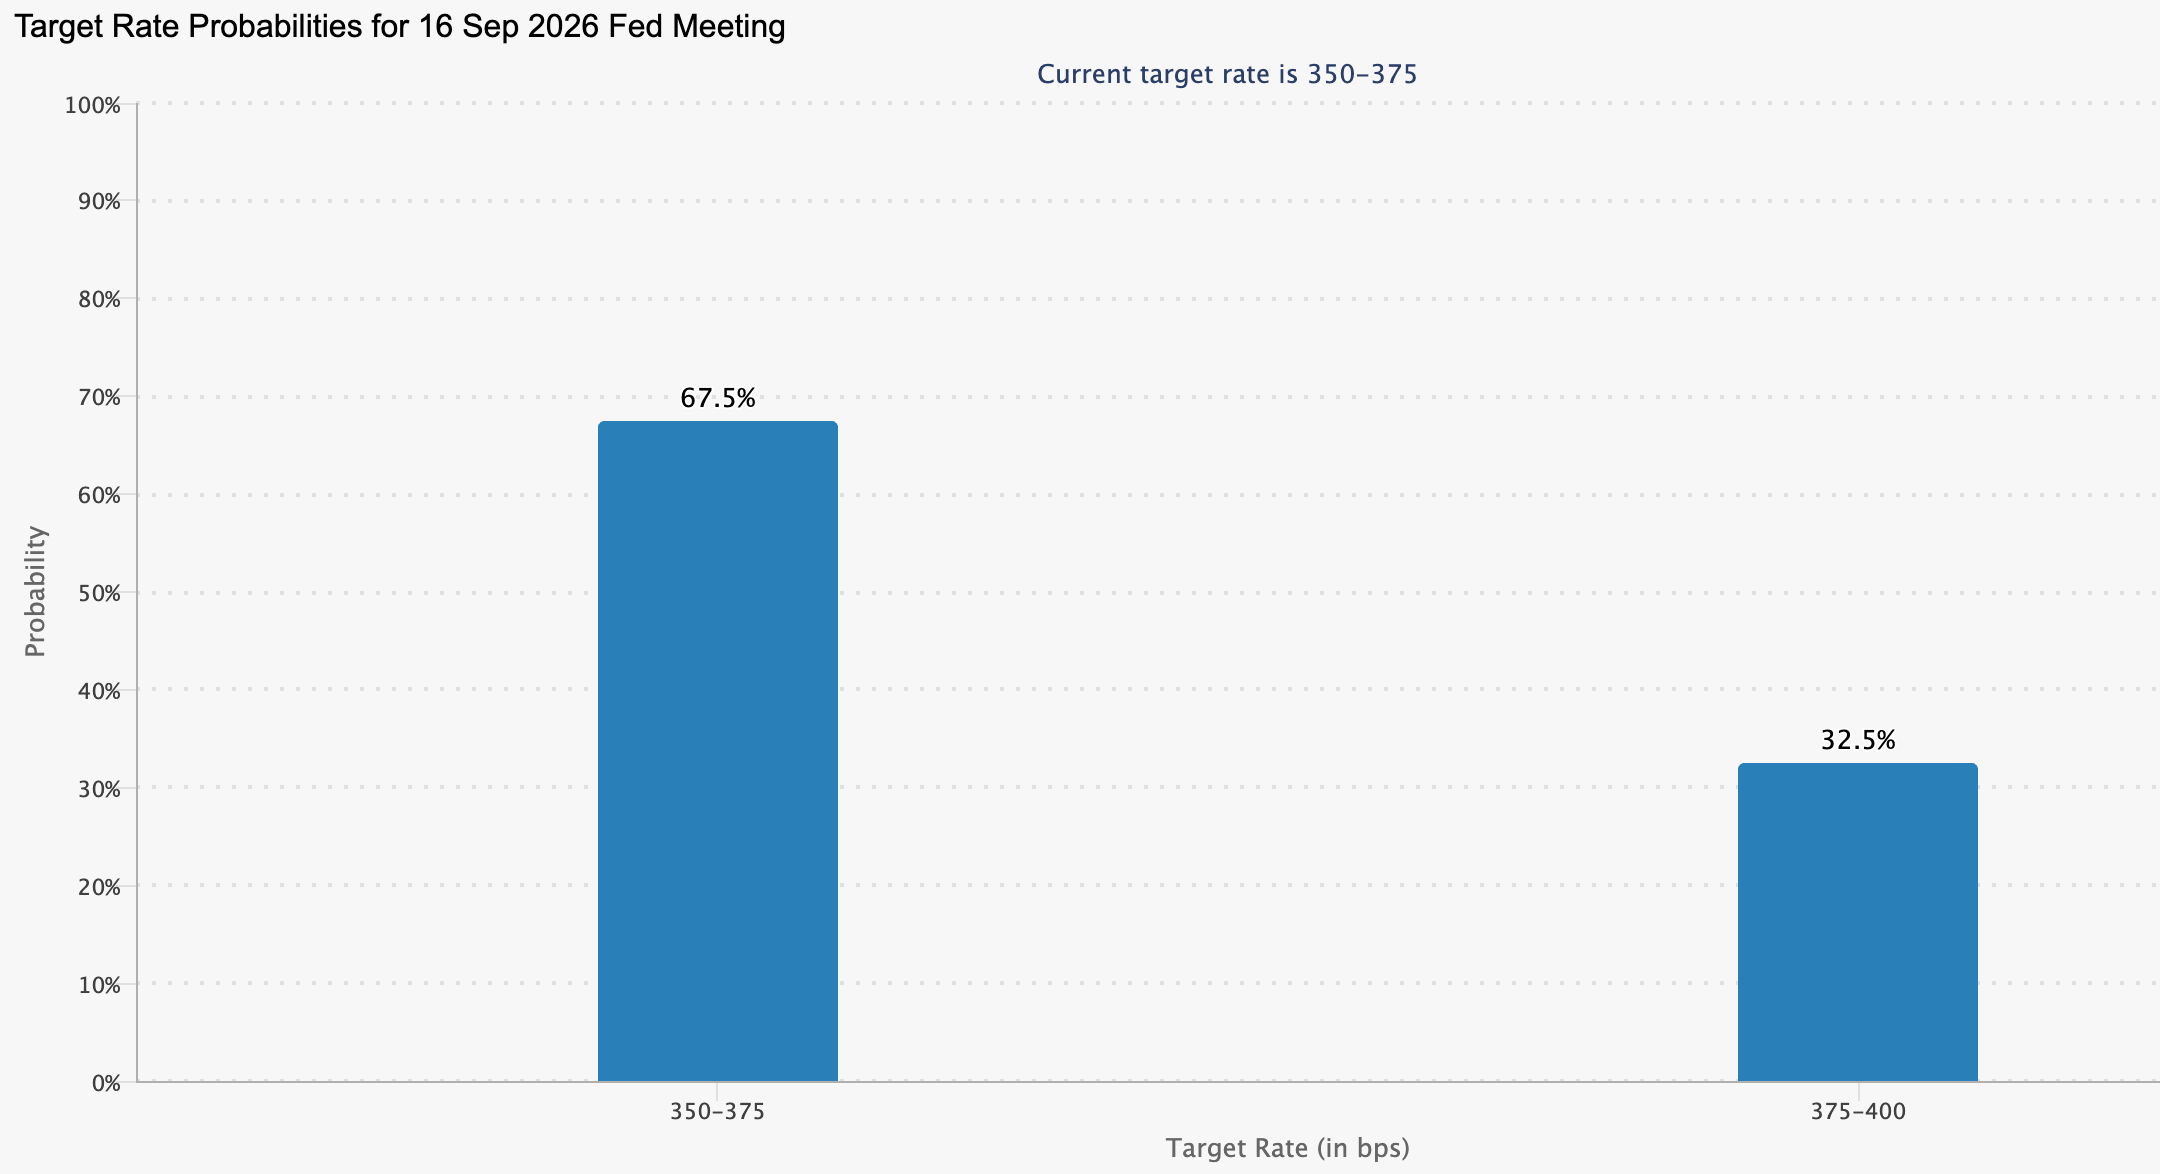
In summary, the expectations as of today are:
Probability of a Hike: ~31%–34% chance of a 25-basis-point increase.
Probability of a Hold: ~65%–69% chance rates remain unchanged.
Corporate Highlights & Semiconductor Volatility Reddit (RDDT) surged 12% today on news that the platform will officially be added to the S&P 500 index prior to the opening bell on August 18.
Meanwhile, semiconductor firms experienced broad fluctuations:
Sandisk (SNDK): Soared over 35% this week following strong revenue guidance.
Applied Materials (AMAT): Dropped -5% today despite beating earnings.
Micron (MU): Gained 10.7% this week suggesting the bottom is in.
(Note: MU and AMAT are tracked daily using levels in the Founding Members Exchange Hub).
High-Probability Trades This Week These setups shared last weekend performed exceptionally well:
SPCX: Reached our extended target of 142.8 for a 7.3% gain 🎯.
NFLX: Reached its extended level of 78.7 for a 6% gain 🎯.
WMT: Gained 3% this week, crossing our 114.8 target 🎯.
TSLA: Reached our extended target of 347 for a 5.8% gain 🎯.
AMZN: Fell as anticipated. Its 4.3% weekly loss crossed the 267 first target 🎯 and is getting closer to 261.
Modeled last Friday, these levels have proven essential for setting targets AND managing risk. This week, expectations for bullish continuation in AAPL and IBIT were invalidated when they lost their central weekly levels at 310 (-1%) and 36.4 (-1.1%), respectively. Using these levels correctly offers a significant improvement in risk to reward ratios: average gains sit at 4%, while average invalidation is just 1%.
Upgrade your subscription to the paid plan, and receive modeled price levels on Fridays for the week ahead, Weekly Compass with technical analysis and high probability setups on Saturdays, market intelligence on Wednesdays, plus daily levels for the SPX and ES Futures.
Let’s study the levels for next week for our watchlist as usual:
Indices & Futures: SPX, NDX, DJI, IWM, ES=F, NQ=F
ETFs: SPY, QQQ, SMH, TLT, GLD, SLV, DIA, VXX
Major Stocks: AAPL, MSFT, GOOG, AMZN, NVDA, META, TSLA, BRK.B, LLY, WMT, AVGO, COST, JPM, XOM, PLTR, NFLX, V, AMD
Crypto & Related: Bitcoin, Ethereum, ETHA, IBIT
Leveraged ETFs: TQQQ, SQQQ, UDOW, SDOW, UPRO, SPXS, URTY, SRTY
These levels are modeled every Friday for you, providing the information needed to assess risk and reward before the market opens on Monday. You don’t have to wait for the opening bell to decide your plan and which securities to trade; you have here the distances to essential levels and the setups suggesting whether they will act as support or resistance well in advance, so you make informed and serene decisions ahead of Monday morning.
In case you missed, this week I posted the fundamental updates for AAPL, MSFT, TSLA, AMZN, GOOG, META, and SPCX. Get facts and objective information here:


Let’s begin,
WEEKLY LEVELS: AUGUST 17TH - 21ST
With the FOMC meeting minutes dropping next week, market indecision is reaching a boiling point considering that not everything across the market is aligned for a continuation rally.
See below the S&P 500 hovering right at its central weekly level (bullish above it, bearish below it), but the Dow Jones has already slipped beneath it. Under the surface, divergences are growing: NVDA and AMD are flashing relative strength, while AVGO sits in negative territory and the Magnificent Seven show a fragmented mix of setups. Use the red/green highlights as a guide: