


I began investing and trading with real dedication and discipline in 2016. That is already 10 years ago, when I started buying stocks the way many people do: reading the news, trying to build a bullish case with fundamentals, and listening to expert opinions. I always liked candlesticks as a visual representation of price action, and back then, I studied several books on the subject. Because no single technical indicator works in isolation, I learned about oscillators (Stochastic, RSI), Bollinger Bands, moving averages, and measuring my performance against the SPX. Back then, I focused heavily on the FAANGs (if you remember that acronym, congratulations; staying in this arena this long puts you far above the average investor or trader: Facebook, Amazon, Apple, Netflix, and Google).
The year 2017 looks easy on a long-term chart, but back then, the rapid swings whenever Trump tweeted or spoke were hard to manage, the market was getting used to it. The conventional approach of candlesticks and oscillators helped me navigate entries and exits when the day closed, but not the sudden intraday swings triggered by a tweet about “Rocket Man” (when North Korea was launching missile tests over Japan), or sudden statements about job creation and bullish news that sparked rapid rallies. That was when I started analyzing support and resistance levels to pinpoint where price could bounce or reverse, but most importantly, where I needed to protect capital or gains during an unexpected swing.
I learned the hard way that algorithms are programmed to hunt stop losses. I used to place stop losses for long positions directly at key levels rather than below them, only to watch them get triggered right before price bounced back. I also learned the importance of trailing stop losses upward. When price reached resistance, it could reverse rapidly, as it is happening today (happened with TSLA this week once the gap we were targeting was filled) and human nature tempts you to wait for a bounce or wanting more. Or, once you hit a psychological target in profit or account balance, you resist exiting below that peak. That hesitation usually ends up being an expensive mistake when you finally capitulate and sell too late. It is human, it has happened to all of us.
Because of this, I began working with structured scenarios. Using predefined levels, I mapped out exactly how my capital, gains, and losses would look if a stock or ETF moved toward specific price targets. It left me far better prepared psychologically. That is also why I post the Support and Resistance Levels every Friday for the week ahead, along with the monthly levels and percentage variances, so the impact on any position can be calculated in advance considering each person’s capital. The ones for next week and September are here for the SPX, NDX, futures, key ETFs like SPY, QQQ, DIA, IWM, megacaps like NVDA, AAPL, AMZN, PLTR, AMD, metals, and crypto ETFs.

Returning to the timeline, 2017 ended well, but 2018 arrived with a sharp selloff in February. The Dow Jones dropped 7% in two days as the 10-year Treasury yield spiked to a four-year high. That was a swift flush for late buyers chasing the 2017 rally; conditions were overbought, and the macro backdrop triggered the reset.
Price eventually recovered. The uptrend resumed in April, new all-time highs arrived by August, and September bypassed the typical volatility seen in midterm election years. Everything seemed calm until Tariff War 1.0 escalated. Meanwhile, the rate hikes that started in March continued, despite heavy political pressure on Jay Powell. By year-end, the federal funds rate had climbed from 1.25%–1.50% up to 2.25%–2.50%. That tightening cycle, combined with a government shutdown, set the stage for a late-year bear market with a -20% correction in the SPX.
Navigating my first official bear market taught me how psychological denial blinds traders when technicals are clearly overbought. I also learned the significance of unfilled price gaps at all time highs: the July 9, 2018 gap on the SPX at 2,764 finally filled after a clean reversal on September 21, when the daily candle breached the upper Bollinger Band alongside a clear bearish RSI divergence.
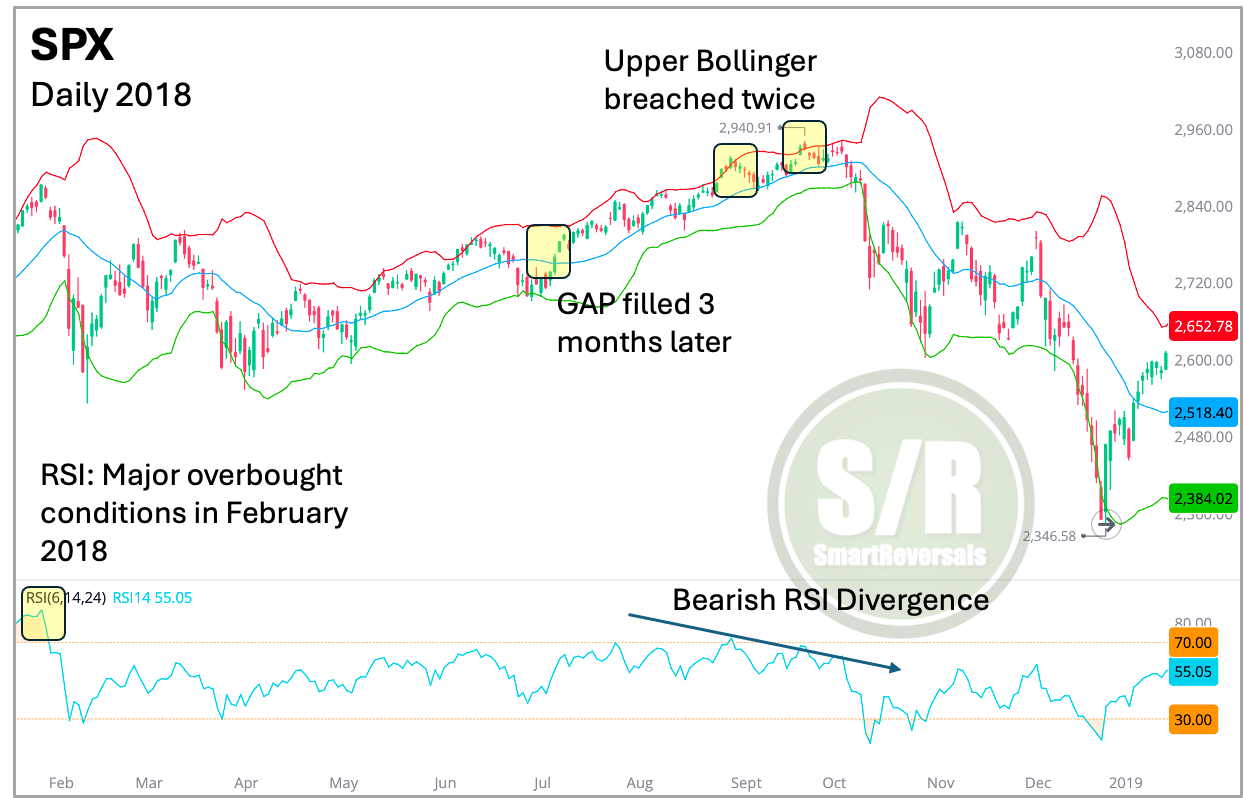
Like 2018, midterm election cycles often bring rate shifts and evolving central bank dynamics. The parallels to our current market setup in 2026 are striking, especially when looking at the technical conditions we have been tracking.
Charts do not repeat exactly the same, but technical patterns do, choppy price action is here to stay, the SPX is near all time highs, rapid reversals are happening when the bullish targets are reached.
With that said, staying disciplined with the process, analyzing technical conditions, adhering to modeled levels, monitoring the 59% probability of a September rate hike, and staying alert to broader breadth deterioration will all be essential to navigating the days ahead.
Below is the 5 day change in the S&P 500. The most notable bullish moves came from semiconductors, while four of the “Magnificent Seven” fell or closed flat (MSFT, GOOG, AMZN, AAPL). Several stocks posting gains are either recovering from oversold conditions (such as META, WMT, and ORCL) or bouncing after weeks of steady declines (like MU, INTC, and AMD).
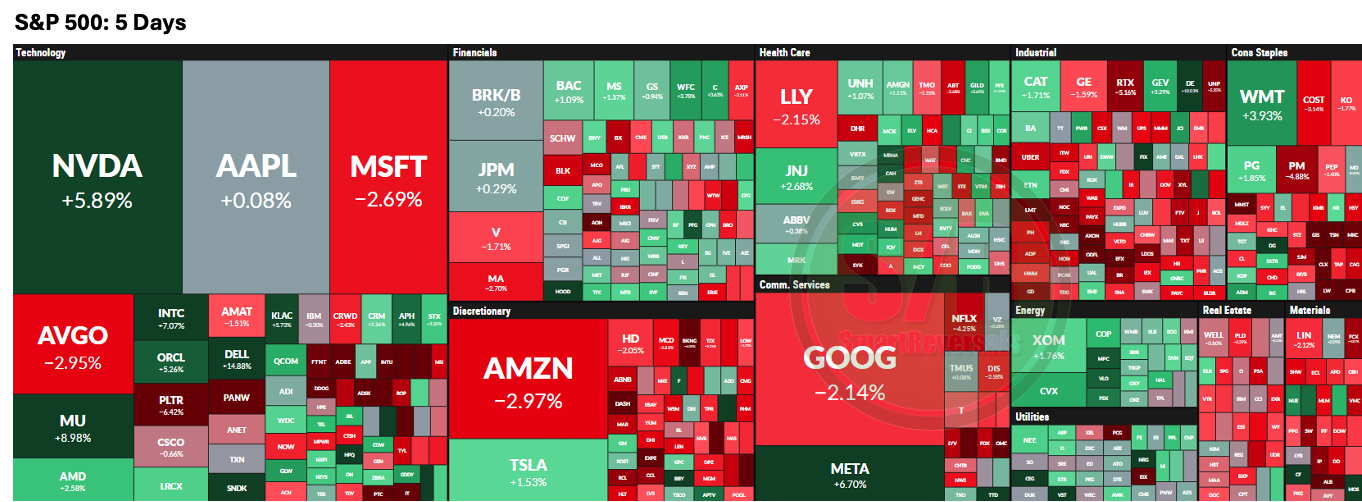
Is everything bearish? No. Disciplined technical analysis and an active watchlist consistently provide opportunities even in choppy markets.
Last week, the anticipated setups for WMT🎯, SPCX🎯, SMH🎯, AAPL🎯, IWM🎯, NFLX🎯, and SPX🎯 averaged a weekly gain of 3% each. Only two setups moved differently than expected, but by using stop-loss references, our support and resistance levels helped protect capital on those two defensive plays (XOM and AMZN). That marks a 7:2 win ratio during a week when the SPX closed virtually flat at +0.1%. And even better, the setups blueprint shows the price levels for all the watchlist, if you are a TSLA, NVDA, or IBIT permanent enthusiast, the setups for all this watchlist is presented below:
Indices & Futures: SPX, NDX, DJI, IWM, ES=F, NQ=F
ETFs: SPY, QQQ, SMH, TLT, GLD, SLV, DIA, VXX
Major Stocks: AAPL, MSFT, GOOG, AMZN, NVDA, META, TSLA, BRK.B, LLY, WMT, AVGO, COST, JPM, XOM, PLTR, NFLX, V, AMD
Crypto & Related: Bitcoin, Ethereum, ETHA, IBIT
Unlock this objective approach by upgrading to the paid plan. Subscribers also get access to educational content and Market Intelligence analyses, fundamentals, and how to get the most out of the high-probability setups. Everything is available at smartreversals.com. Zero gut feeling. Everything is specific.
My complete Market Intelligence and educational content is here, paid subscribers have access to all the linked content and my two downloadable eBooks on technical indicators, they include real life charts.

Today’s Agenda
Market Context: Charts+levels for SPX, Indices, ETFs, VIX, Breadth, and Crypto.
Deep Dive: Individual analysis with charts and targets for Mag Seven and setups.
Momentum Map: Analyzing the stage of every security in a single view.
Setups Blueprint: Entry levels for short and long setups with price targets and invalidation levels for all the securities in the watchlist prioritizing stronger setups.
Let’s begin.
SPX: Is a Correction Coming?
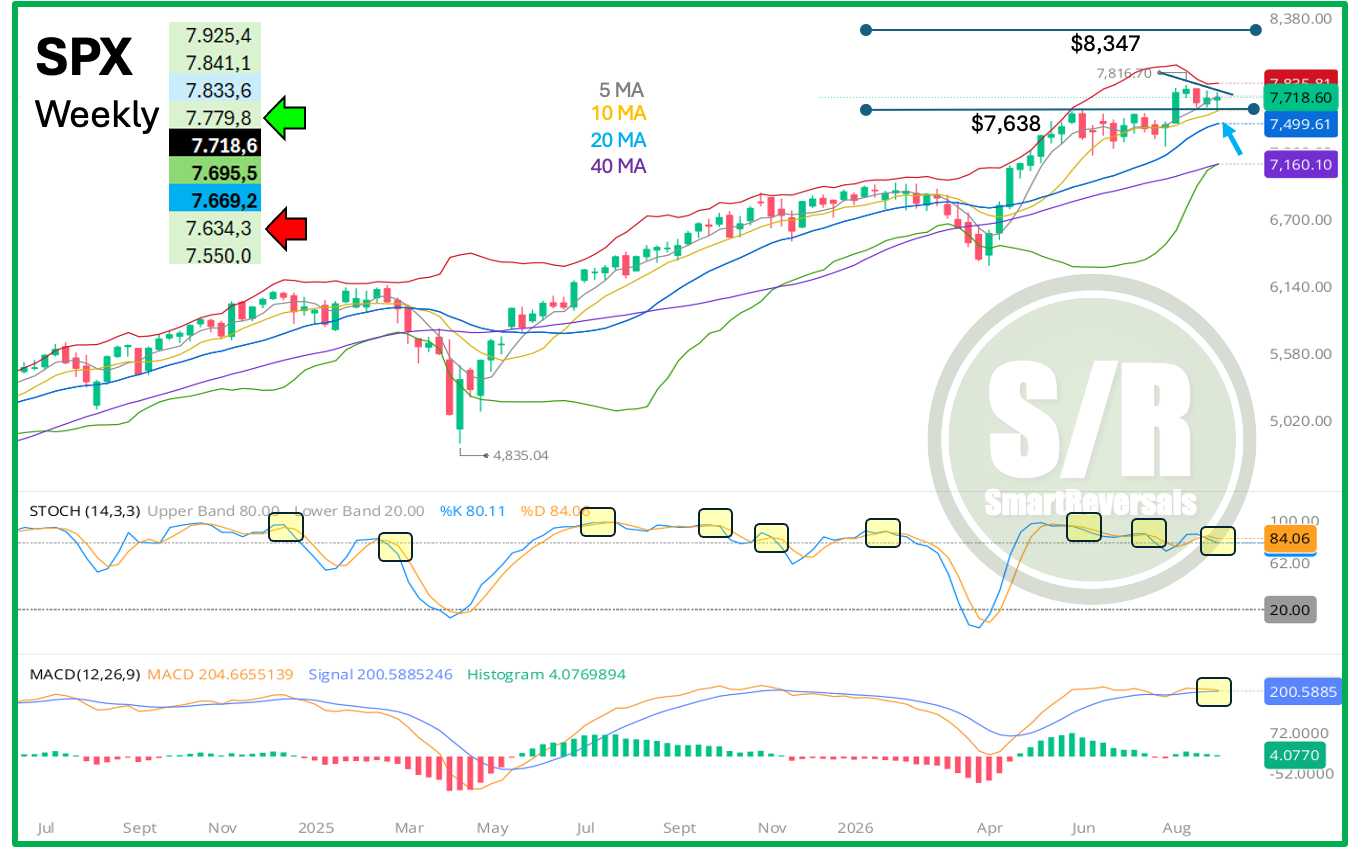
As highlighted in the chart, the series of lower highs continue in play, with the annual level of 7,638 supporting the price for third consecutive week. One of those two lines will break and define the next move.
Breakout Scenario: When you expect a development be always sure to consider the opposite scenario, in this case it’s worth considering that the rate remains unchanged in the next FOMC meeting, and/or a peace deal is signed with Iran. The first one is 40% likely, the second one could be priced in, since the market reached new all time highs despite of the geopolitical conflict and contradicting communications between both sides.
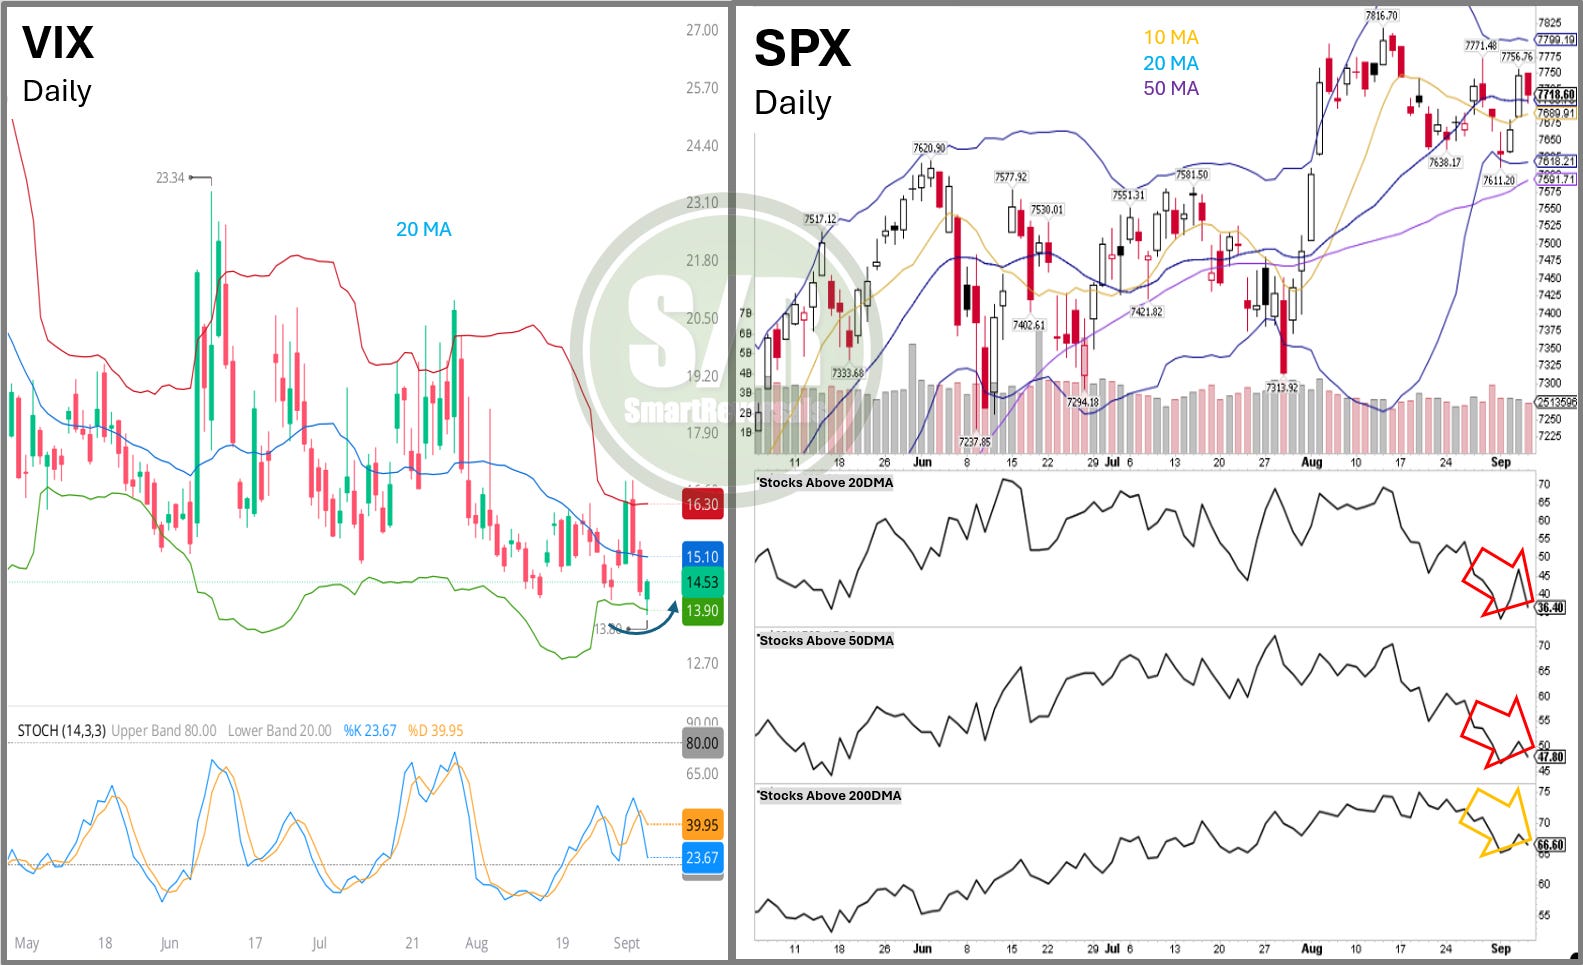
Breakdown Scenario: The rate hike is 60% likely, the Dow Jones has a gap open at $52,6K (-1.5% from is close), the SPX has one at 7,610 (-1.4% from Friday’s close), and the Volatility index (VIX) closed at the year’s lows with an indecisive action breaching the lower daily band (chart below).
Any rally before filling the gap becomes an opportunity for bears, and once the gap gets filled the next strong line of defense sits at 7,500.
There have been several Hindenburg Omen signals, one signal looks for underlying market fragility when an index appears healthy on the surface, but internal participation is severely fractured. It identifies rare periods where both new 52-week highs and new 52-week lows spike simultaneously while the broader index is still near highs. This divergence indicates extreme market indecision and bifurcated internals.
Caution is key, risk favors bears with the current conditions, yes, the CWL is below Friday’s close, so any lose of that level (which is not far from the monthly one) would be a reason of concern. Conditions favor a decline.
SPX Close: $7,718.6 Above CWL $7,695.5 (-0.3%): immediate target $7,779.8 (+0.8%), with a potential extension to $7,841.1 (+1.6%). Below CWL, immediate destination $7,634.3 (-1.1%).
SPY: Above CWL $767.9 (-0.3%): immediate target $776.3 (+0.8%), with a potential extension to $782.5 (+1.6%). Below CWL, immediate destination $761.8 (-1.1%).
VOLATILITY AND BREADTH
VIX: The Volatility Index closed at the lows of 2026 with a candle signaling indecision, attempting to bounce after tagging the lower Bollinger Band. Historically, this condition has preceded sharp volatility spikes. Keep in mind that the VIX still has unfinished business near 24.3.
STOCK PARTICIPATION: The Bollinger Bands are contracting into a narrow range between 7,800 and 7,620. Recent daily price action remains weak: market breadth shows only 30% of S&P 500 stocks trading above their 20DMA, 47% above their 50-day moving average, and the percentage above the 200-day moving average is rolling over with increasing downward velocity now that the shorter-term averages have broken down.
VXX: $17.7 Below CWL $18.0 (+1.7%): immediate target $17.2 (-2.8%), with a potential extended move to $16.6 (-6.2%). CWL recovery opens $18.0 (+1.7%).
NDX: Price action found temporary support at the annual level of 29,036, printing an indecisive daily candle that lacks bullish conviction. Friday’s close signaled hesitation, forming a bearish diagonal structure that requires an upside breakout to confirm any bullish resolution. For now, the primary confirmed signal is a bearish stochastic crossover paired with a doji printed on Friday. Any sustained move below the central weekly level will accelerate downside velocity. If tech manages to hold neutral or slightly green into next week, the next volatility expansion will likely hold off until the mid-September Fed meeting. The 29,815 zone marks a potential reversal area next week in case of immediate bullish continuation; that thesis requires confirmation via an explicit rejection or failure to hold the level upon arrival.
Semiconductors carried the NDX this week while the Magnificent Seven lagged.
Above CWL $29,384.2 (-0.5%): immediate target $29,815.2 (+0.9%), with a potential extension to $30,086.2 (+1.8%). Below CWL, immediate destination $29,113.2 (-1.5%).
QQQ Close: $719.0 Above CWL $715.2 (-0.5%): immediate target $725.7 (+0.9%), with a potential extension to $732.4 (+1.9%). Below CWL, immediate destination $708.5 (-1.5%).
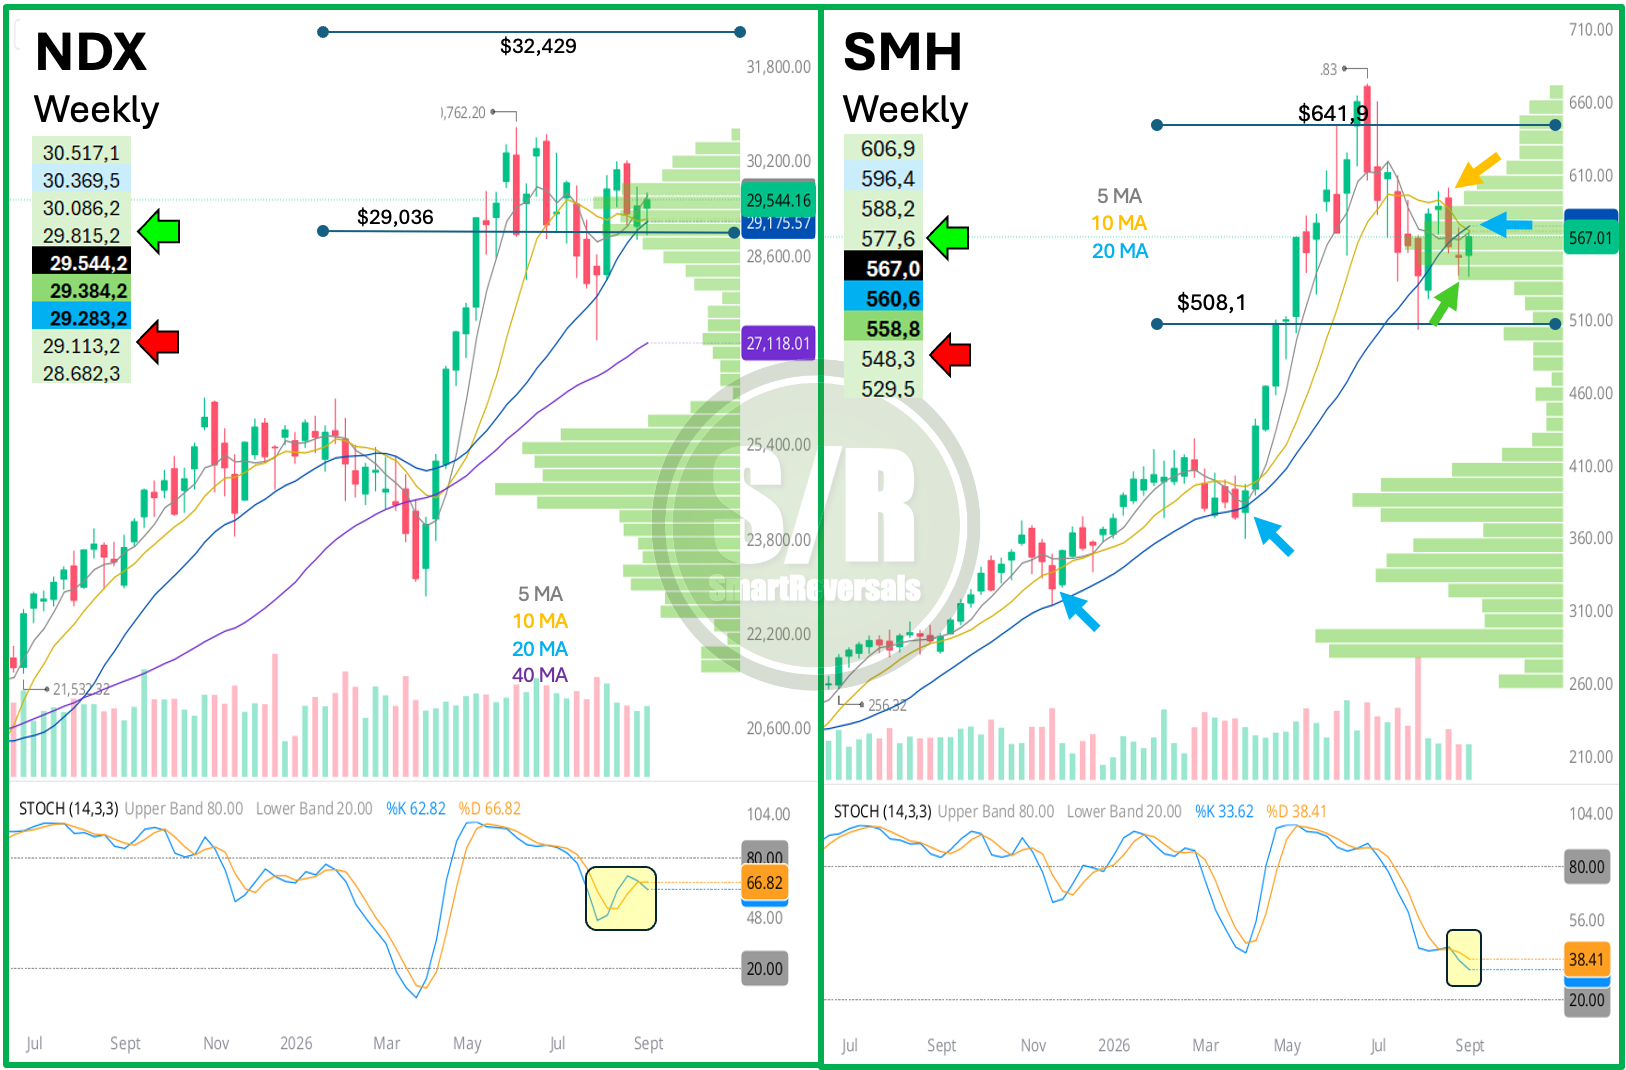
SMH: Semiconductors delivered a promising move by reclaiming the central monthly level. However, price remains below the 20WMA, line lost last week that requires stronger buying conviction to retake. On the constructive side, 553.7 is acting as an upside price magnet, and price is drifting closer to it. NVDA reached daily overbought territory, which warrants caution. However, MU is displaying genuine bullish conviction, and AMD is executing a steady bounce without technical invalidation. This resilience in tech is a core reason why a 2018-style bear market remains unlikely right now: several market heavyweights are not hovering at all-time highs, but rather bouncing out of deeply oversold bases. AVGO holds multiple unfilled gaps above that remain attractive targets, and some Mag Seven components are likewise rebounding from oversold levels. For a complete trend recovery, SMH must decisively recapture the 20-week moving average, which currently sits at 574. Above CWL $558.8 (-1.4%): immediate target $577.6 (+1.9%), with a potential extension to $588.2 (+3.7%). Below CWL, immediate destination $548.3 (-3.3%).
DJI: As the index that respects technical indicators most consistently, the Dow has two unfilled gaps below signaling that a 1.5% pullback remains in progress. The sooner those fill, the healthier it is for bulls. Any premature push higher here merely offers a more favorable risk-reward short entry for bears. Above CWL $53,284.0 (-0.2%): immediate target $53,876.7 (+0.9%), with a potential extension to $54,339.2 (+1.7%). Below CWL, immediate destination $52,821.5 (-1.1%).
DIA Close: $534.1 Above CWL $532.8 (-0.2%): immediate target $538.9 (+0.9%), with a potential extension to $543.6 (+1.8%). Below CWL, immediate destination $528.1 (-1.1%).
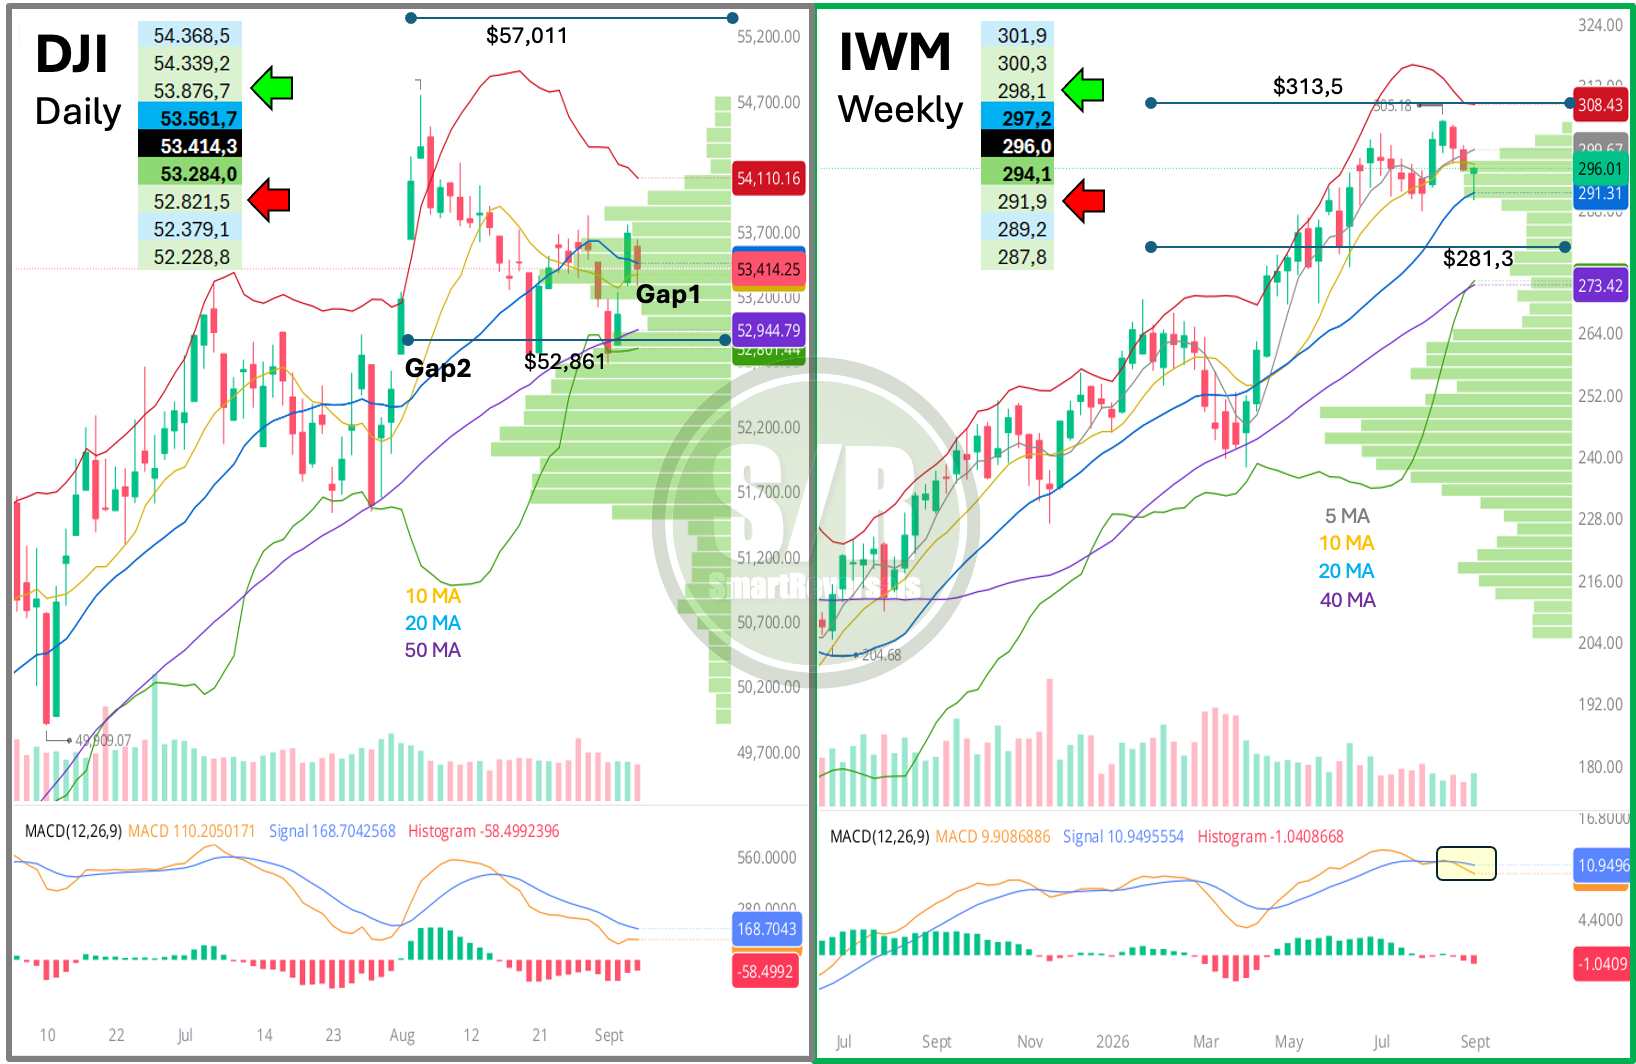
IWM printed a potentially constructive candle by bouncing from its 20 WMA. The bullish scenario remains viable as long as price holds above 294.1, with stronger confirmation arriving upon a clean recovery of the central monthly level at 297.2. Meanwhile, a bearish MACD crossover indicates that deeper downside remains on the table so be prepared for a rapid reversal from a resistance level. That breakdown thesis would be confirmed by losing the central weekly level; breaching 291 opens the door to an immediate test of 281 and potentially 279. As we have studied, IWM tends to rotate cleanly from Bollinger Band to Bollinger Band unless the 20 WMA halts the move mid-channel. Above CWL $294.1 (-0.6%): immediate target $298.1 (+0.7%), with a potential extension to $300.3 (+1.5%). Below CWL, immediate destination $291.9 (-1.4%).
GLD: Gold printed an indecisive candle following heavy selling, suggesting that the recent consolidation phase may be nearing completion. The weekly close above the central weekly level is constructive. To avoid a bull trap, price must defend 405.6 as firm support to sustain the advance toward the first major hurdle and immediate bullish target at 416. The upside thesis stays intact with manageable risk using 405.6 as the primary invalidation level, while longer-term investors may prefer anchoring to the central monthly level. Above CWL $405.6 (-0.3%): immediate target $414.7 (+2.0%), with a potential extension to $422.7 (+3.9%). Below CWL, immediate destination $397.6 (-2.3%).
SLV Close: $59.8 Above CWL $59.5 (-0.5%): immediate target $61.2 (+2.3%), with a potential extension to $62.6 (+4.7%). Below CWL, immediate destination $58.1 (-2.8%).
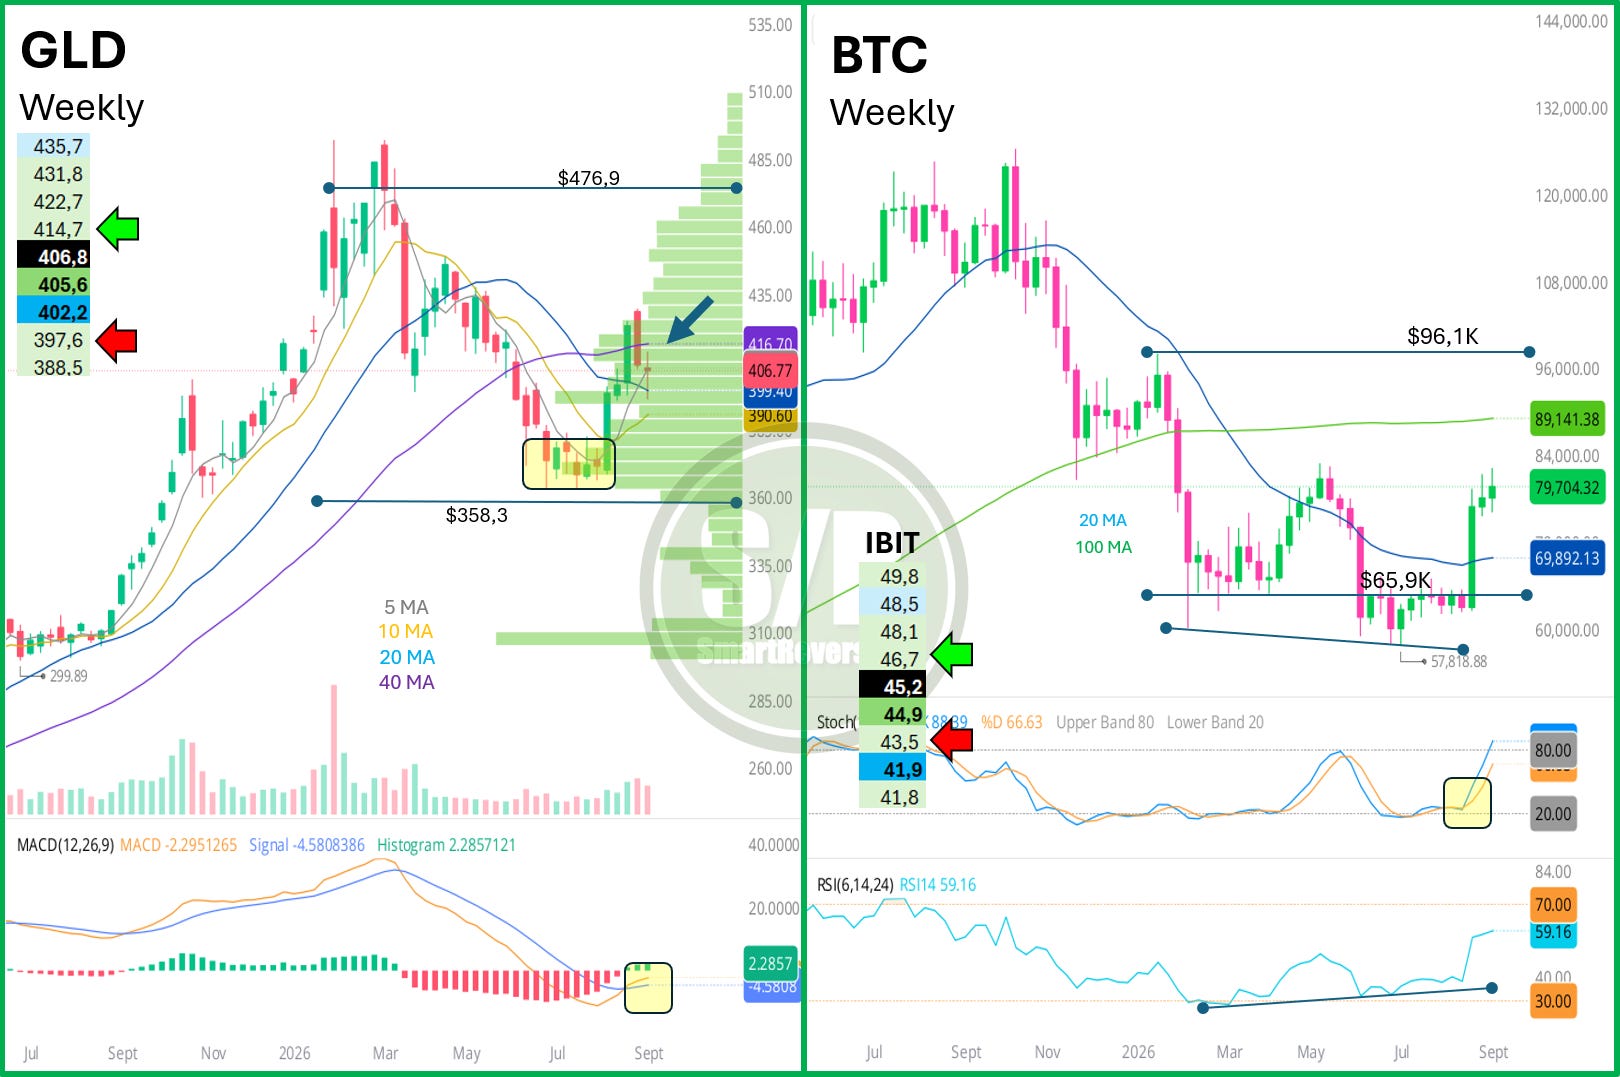
BITCOIN: Price action remains constructive, displaying typical consolidation following the 22% weekly breakout from two weeks ago. Odds strongly favor a cyclical bottom already being in place. Any price action holding above the 74,000 central monthly level remains structurally sound and aligned with support at the 40 WMA. Because price is not overbought on the weekly timeframe, technicals favor further expansion, pointing to primary resistance at 85.9k followed by 89.1k. The macro trajectory for Bitcoin remains bullish. Above CWL $44.9 (-0.7%): immediate target $46.7 (+3.3%), with a potential extension to $48.1 (+6.4%). Below CWL, immediate destination $43.5 (-3.8%).
Momentum Map
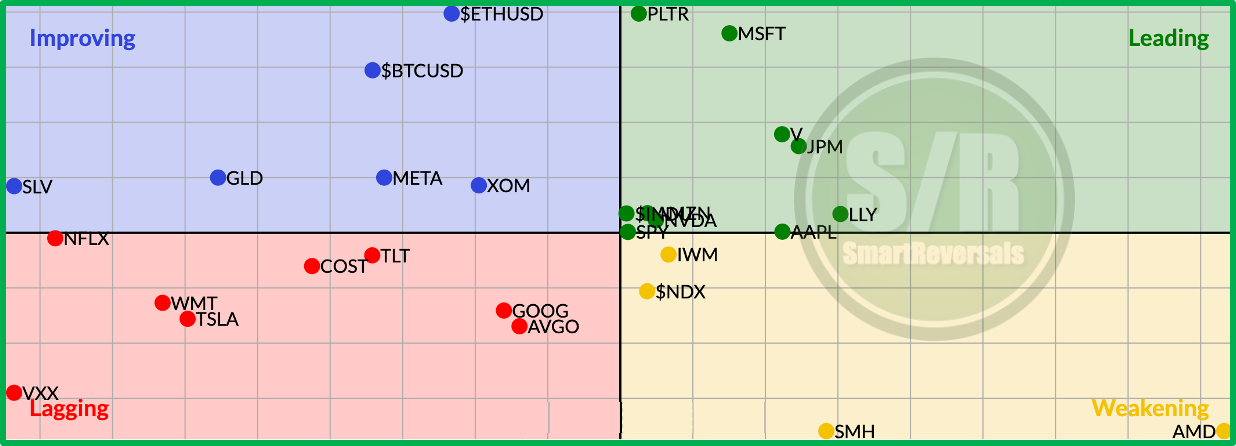
My contrarian approach with this map applies for this week, WMT and AVGO are likely to fill their gaps, GOOG is in a make or break zone described below with the chart that if lost would improve buying opportunities. NFLX is consolidating as TSLA after their gap fills, TSLA is indecisive and risky for bulls and bears today… yes VXX is bouncy.
META, BTC/IBIT, GLD, ETH/ETHA are constructive, staying long with them is valid, I’m usually not contrarian with this quadrant.
LLY looks bearish as JPM and V, confirmation is key by staying below their CWLs, MSFT and PLTR need a healthy consolidation for healthier bullish continuation.
AMD looks bouncy, if SMH didn’t have a gap below I would be bullish on it as well. AAPL is also in a make or break point with an indecisive candle, details below with the chart.
Setups Blueprint
The table below shows the tickers in our watchlist analyzed with their bullish or bearish status, the high probability ideas or my personal picks are highlighted in grey, but it doesn’t mean you cannot navigate a ticker you own or want to trade, the map works like this:
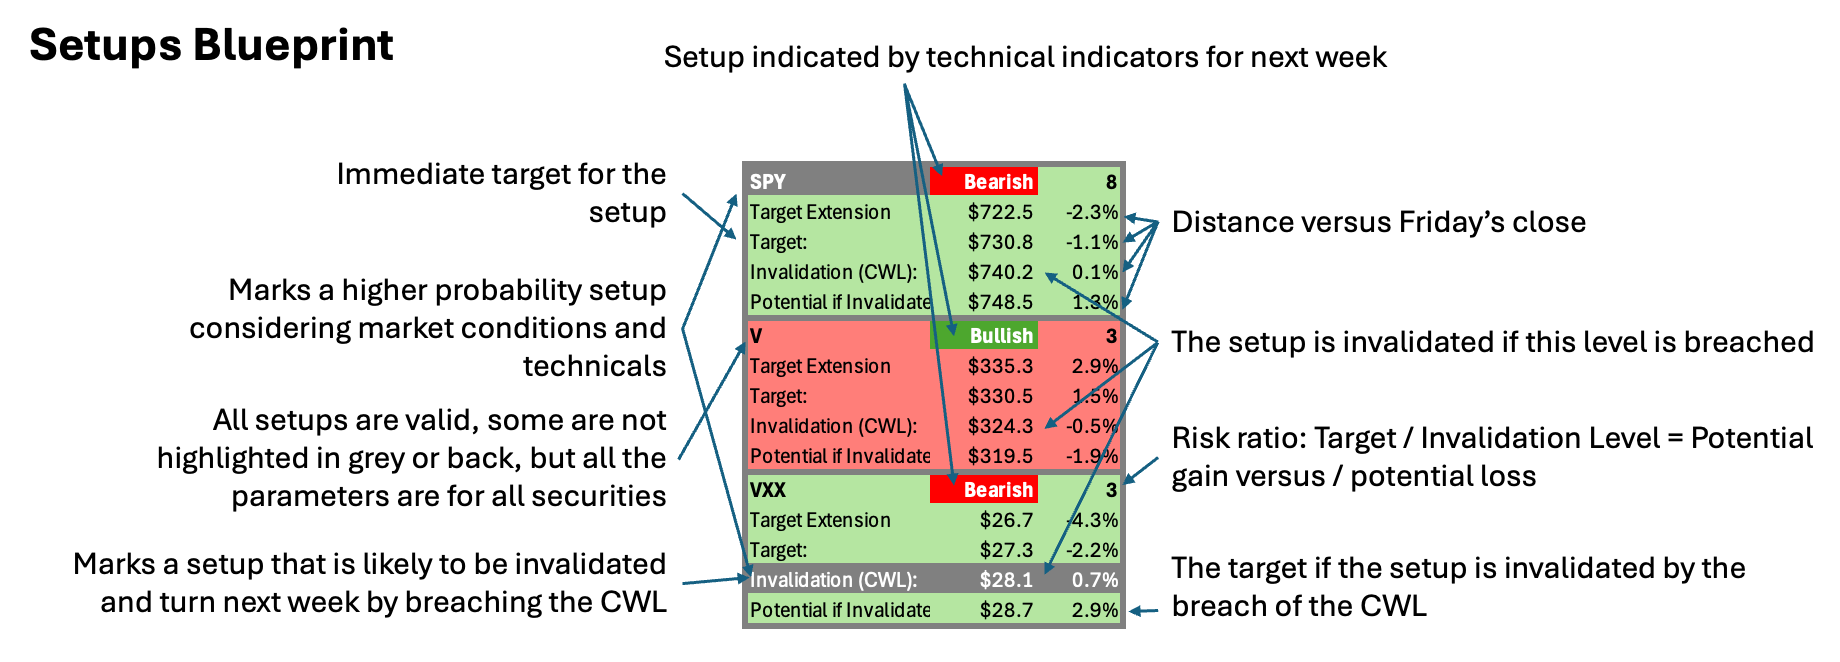
This is the Blueprint for next week, I added notes for each ticker, in case that you like a stock that I don’t highlight as a high probability setup as presented here👇.
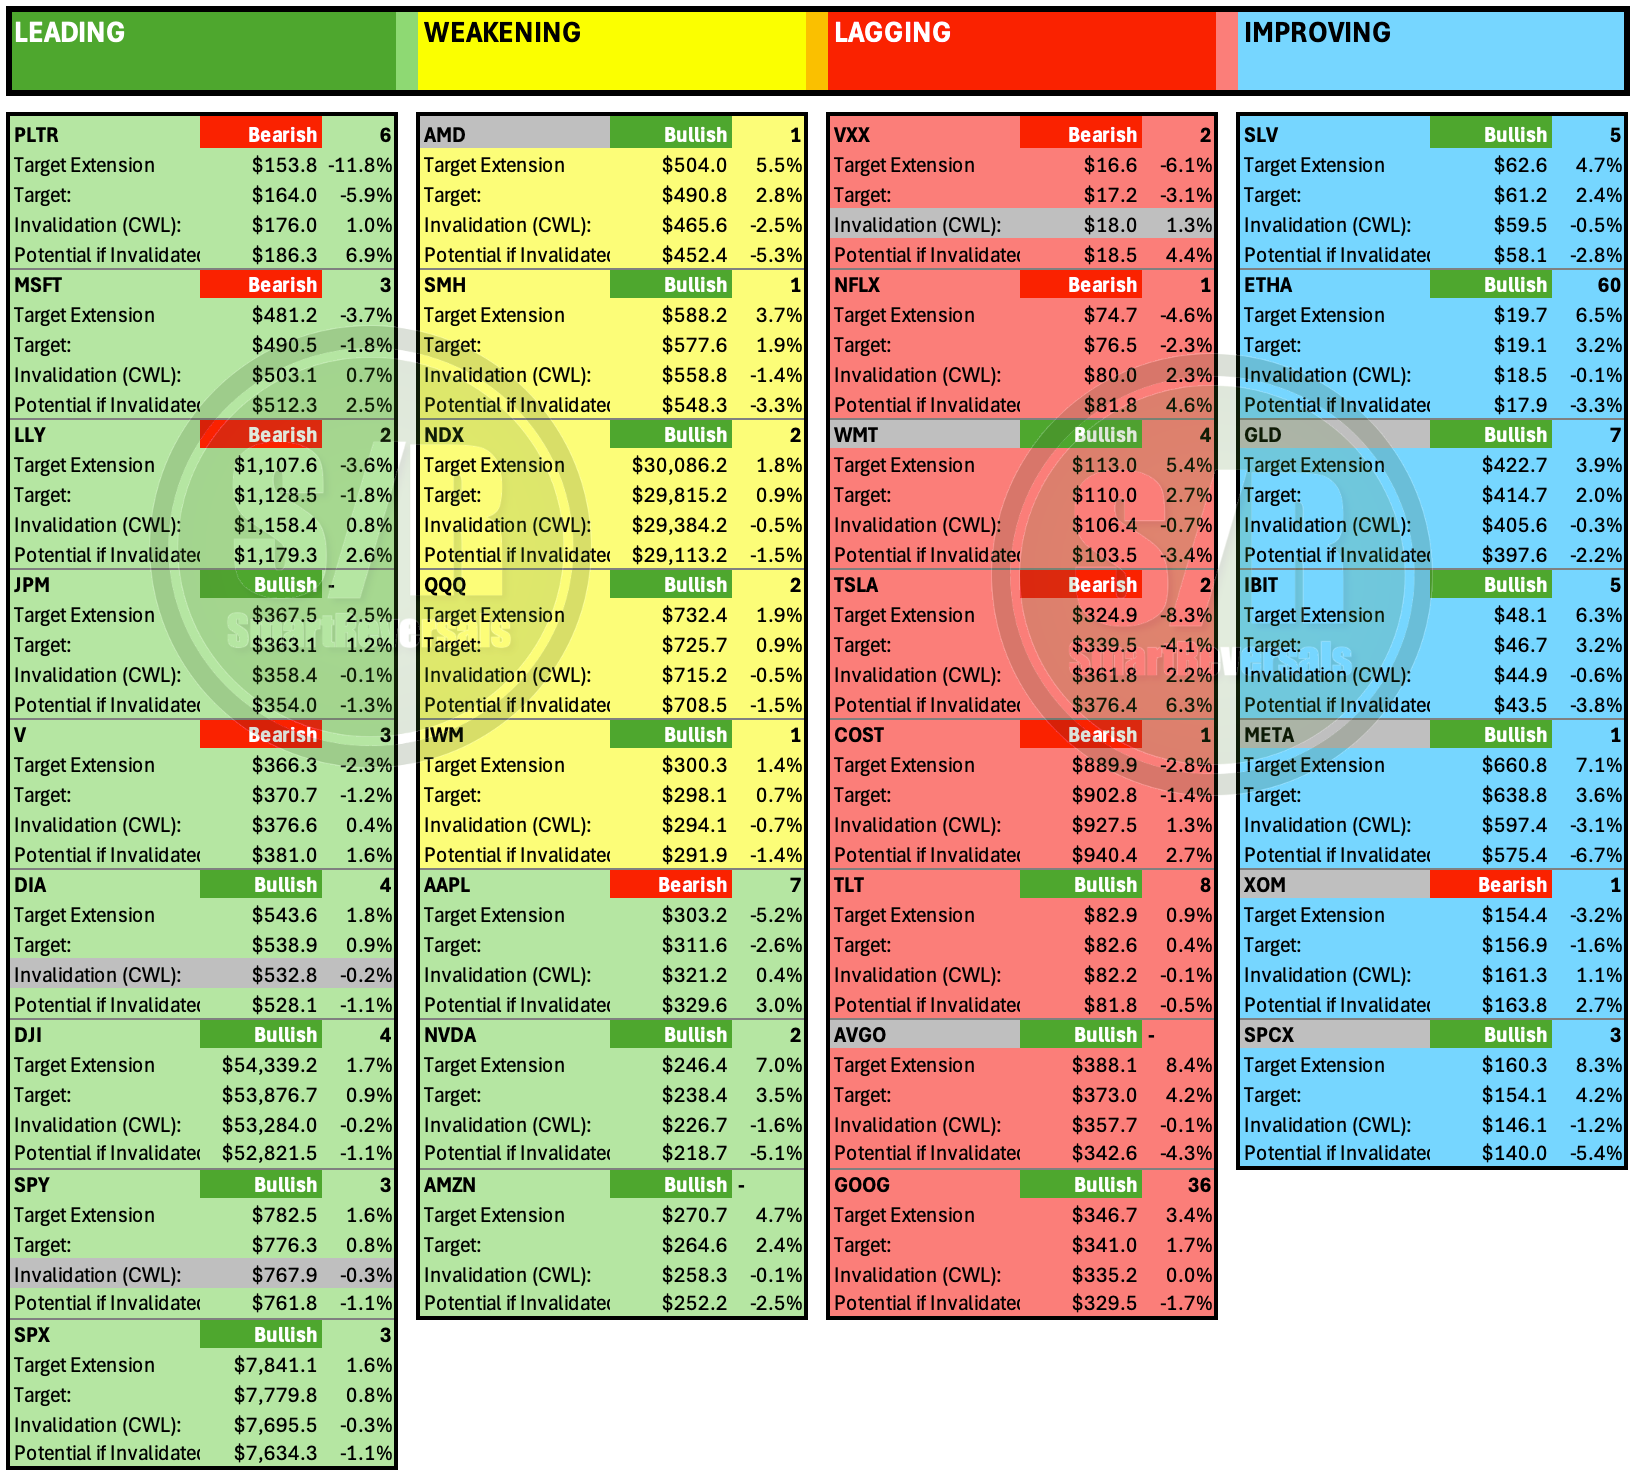
Weekly Blueprint Summary (High Probability Setups)
Top Bullish Setups: AMD, WMT, AVGO, GLD, META, VXX, SPCX
Top Bearish Setups: DIA, SPY, XOM
Valid Moves not Highlighted for Potential Visits to CWL: LLY (Short), SMH (Long), IBIT (Long), COST (Short), NVDA (Long).
Observations for the other securities not listed: